Design Team Goals: A Practical Framework for Impact
By Synopsix · August 12, 2026 · 12 min read
Most advice about design team goals stops at writing cleaner statements. That's not the hard part. The true test is whether a design leader can walk into a finance review, a product steering meeting, or an exec update and show how the team's work changed something the business measures.
That gap matters because goals that sound strategic can still be useless if they don't affect decisions. A team can ship polished work, finish audits, and keep velocity high while still failing to prove value. The strongest design goals now function less like creative aspirations and more like operational targets tied to conversion, retention, time on task, system adoption, and revenue-linked outcomes, with clear ownership and review cycles.
Why Most Design Team Goals Fail to Drive Real Impact
The most common failure mode is simple. Teams write goals that describe effort, not impact. “Improve the onboarding flow” sounds thoughtful, but unless it's tied to a measurable change in task success, conversion, or cycle time, it stays in the realm of good intentions.
That's why executives often nod politely at design goals and then move on. They can't connect those goals to business movement. Modern design measurement guidance treats design goals as measurable values that can be tracked over time, often with percentage-based targets and milestone tracking, because accountability changes the conversation from taste to evidence ([Glow Team](https://glow.team/blog/design-kpis-and-metrics-complete-2025-guide)).
Clarity beats cleverness
Research on public-sector teams found that goal clarity is positively associated with team performance, and that the relationship is stronger when the team shares the same understanding of the goal ([peer-reviewed study](https://pmc.ncbi.nlm.nih.gov/articles/PMC6207990/)). That finding maps cleanly to design work. If one designer thinks a goal means shipping more screens while another thinks it means reducing friction, the team doesn't have a goal. It has a translation problem.
> Practical rule: If two people on the team can interpret the goal differently, it isn't ready.
Many design teams get trapped by output language. Completing a research audit, refreshing a component library, or producing mockups may be necessary work, but those are still activities. The better question is what changed because of that activity. Did fewer users get stuck? Did the team reduce rework? Did adoption of the design system improve? Did a product flow support revenue better?
The best leaders I've worked with don't reject craft goals. They reframe them. They keep the creative quality standard, then attach a business-facing measure that makes the goal reviewable by people outside design. That shift turns design from a subjective function into an accountable operating discipline, which is exactly where senior stakeholders start paying attention.
Shared understanding is the multiplier
Nielsen Norman Group's observation that companies often add about one designer for every 300 employees shows how design has become part of organizational planning, not a sidecar function ([NNG](https://www.nngroup.com/articles/design-team-statistics/)). As teams scale, loose ambition stops working. Leaders need a short list of priorities, shared definitions, and a visible measure of progress.
That's why many practical goal-setting guides recommend selecting only the top 3–5 priorities and clarifying what each one means. Too many goals create drift. Too much ambiguity creates politics. Both weaken execution.
A Step-by-Step Process for Setting Prioritized Design Goals
Start with input, not with a polished statement. The most reliable process I've seen begins by collecting stakeholder feedback, then converting that feedback into candidate goals, then narrowing the list hard. One design-goal workflow recommends exactly that sequence, collect feedback on a draft goal, rephrase each piece of feedback as a goal, share the list with stakeholders, and prioritize it as a group based on organizational importance and stakeholder impact ([Jason Rubenoff](https://jrubenoff.com/writing/engaging-team-in-our-design-goals/)).
The key discipline is restraint. Teams usually don't need 12 goals. They need a small set they can move. That's why the 3–5 goal range matters, not because it's magical, but because it forces trade-offs.
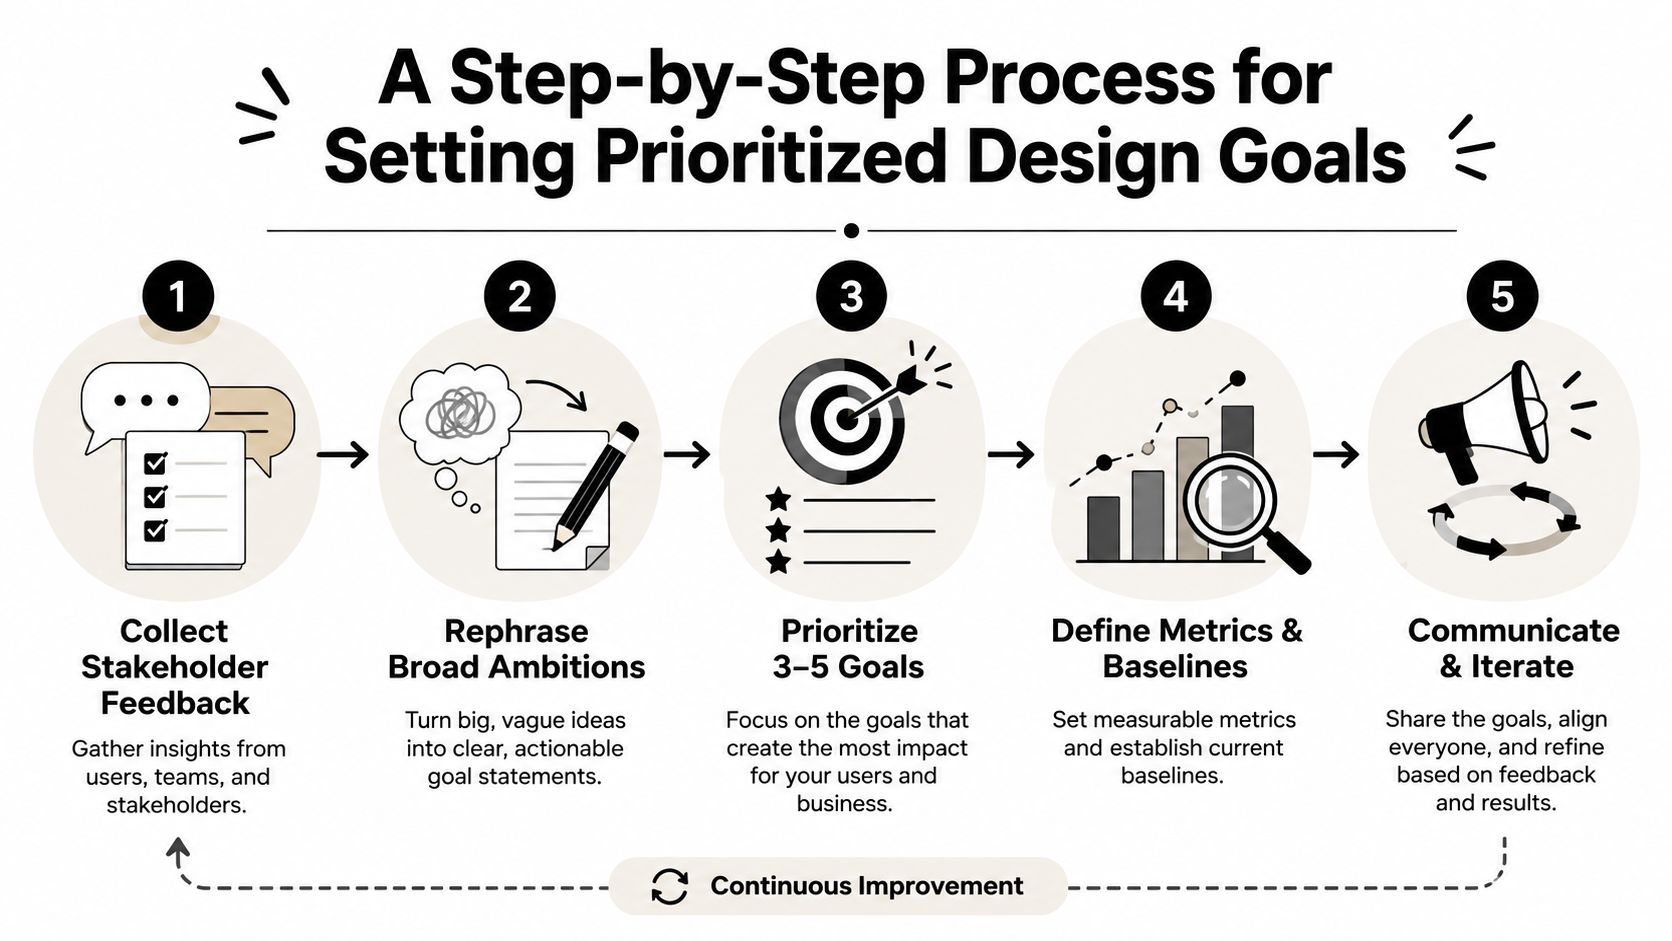
A practical workflow that teams can actually run
1. Collect stakeholder feedback. Pull in product, engineering, research, support, and leadership. Ask what business problem they believe design should help solve. 2. Rephrase broad ambitions. Turn fuzzy input into goal language. “Make onboarding smoother” becomes something testable and discussable. 3. Prioritize 3–5 goals. Group the draft goals, compare them against company priorities, and cut ruthlessly. 4. Define metrics and baselines. Set the starting value, the target value, and the metric that will track movement. 5. Communicate and iterate. Publish the goal set, review it on a cadence, and adjust when the business shifts.
One useful way to separate goal from strategy is the framing used in [practical marketing strategy advice](https://www.oviond.com/marketing-goals-vs-marketing-strategy/). That distinction helps design teams avoid a common mistake, treating a tactic as if it were a goal. “Run more usability tests” is a tactic. “Reduce the time users need to complete a task” is a goal.
A good baseline-target-metric definition keeps the team honest. Industry guidance recommends defining each goal through baseline, target, and metric, then tracking progress with an OKR-style formula, (Current value – Starting value) ÷ (Target value – Starting value) × 100 ([QC Design School](https://www.qcdesignschool.com/blog/2022/12/how-to-set-achievable-goals-for-your-design-project)). That formula is useful because it makes progress legible even when the work is messy.
If a team is improving onboarding, the baseline might be current completion behavior, the target might be a stronger completion rate or less friction, and the metric should be the one the team agrees to watch every cycle. The same structure works for design system adoption. Without a baseline, the goal becomes a feeling. With one, it becomes a decision framework.
For teams trying to align their goals with broader company priorities, a useful companion is the internal guide on [organizational alignment](https://synopsix.ai/blog/organizational-alignment), because design goals rarely fail in isolation, they fail when they're disconnected from the rest of the business.
Connecting Design Goals to Metrics Executives Trust
Most design teams don't lose credibility because the work is weak. They lose it because the evidence is incomplete. A dashboard full of design-specific activity metrics won't persuade a CFO or an operating leader unless it connects to user, operational, financial, and strategic outcomes.
That's why a balanced scorecard approach is so effective. A 2025 industry article recommends shared planning with stakeholders and balanced scorecards that combine those four metric types, while McKinsey argues design should be measured with the same rigor as revenue and cost because leaders need analytical proof of contribution ([Aquent](https://aquent.com/blog/is-your-design-team-proving-its-value-in-2025)). That's the level of proof executives trust.
The metric mix that travels well
A strong dashboard usually includes a mix of measures instead of one heroic number. Task success rate tells you whether users can complete the intended job. Conversion rate shows whether the design supports business movement. Time on task reveals friction. Design system adoption rate shows whether internal consistency is improving. Revenue-linked indicators and retention tie the work to outcomes that senior leaders already monitor.
| KPI Category | Example Metrics | Business Signal | |---|---|---| | User | Task success rate, time on task | Friction, usability, completion quality | | Operational | Cycle time, design system adoption rate | Delivery efficiency, consistency, reuse | | Financial | Conversion rate, revenue-linked indicators | Commercial impact, monetization support | | Strategic | Retention, milestone completion | Progress against company priorities |
The point isn't to stuff every metric into one dashboard. It's to create a view that lets design sit beside the rest of the operating model. When product and finance look at the same page, they should see how design changed the shape of the business conversation.
A helpful resource on this bridge between the work and the business is [connecting business to product](https://www.925studios.co/blog/what-is-design-strategy), because design leaders often need to translate creative decisions into product language before executives will engage.
> Practical rule: If a metric can't be compared quarter over quarter, it won't survive an executive review.
Percentage-based targets and milestone tracking help here because they make progress comparable across teams and time. They also force a conversation about what “better” means before the work starts, not after the presentation deck is built. For a deeper internal benchmark model, the guide on [how to measure team performance](https://synopsix.ai/blog/how-to-measure-team-performance) is a useful companion.
Using Behavioral Data to Build Smarter Team Goals
Most goal-setting frameworks assume the team composition is fixed and the only question is what to ship next. That's too optimistic. The people doing the work shape the goals that are realistic, risky, or too vague to execute.
Behavioral assessment data changes the planning conversation. Synopsix, for example, turns scientifically validated behavioral assessments into comparable profiles, then uses simulations, compatibility analysis, and development plans to translate those profiles into business signals. Used well, that kind of data helps a leader decide who should own what, where friction is likely, and which goals need extra support from the start.
Match the goal to the team you have
A team with strong analytical complementarity may be well suited to a goal that requires heavy cross-functional coordination. A team with clear communication gaps may need a narrower goal and tighter stakeholder checkpoints. That isn't lowering the bar. It's designing the operating plan around reality.
A useful companion perspective is [guide to data driven product design](https://www.uxia.app/blog/data-driven-design), because design goals become stronger when the evidence behind them isn't limited to product analytics alone.
Behavioral profiles also make development goals more practical. Instead of writing vague growth statements, leaders can align individual development with team needs. If one person is likely to absorb ambiguity well, they may be a good owner for an exploratory initiative. If another person thrives in structured execution, they may be better positioned for a goal that depends on clean coordination and milestone discipline.
For teams evaluating this kind of work, [team dynamics software](https://synopsix.ai/blog/team-dynamics-software) can make the complementarity and tension points more visible before a project starts.
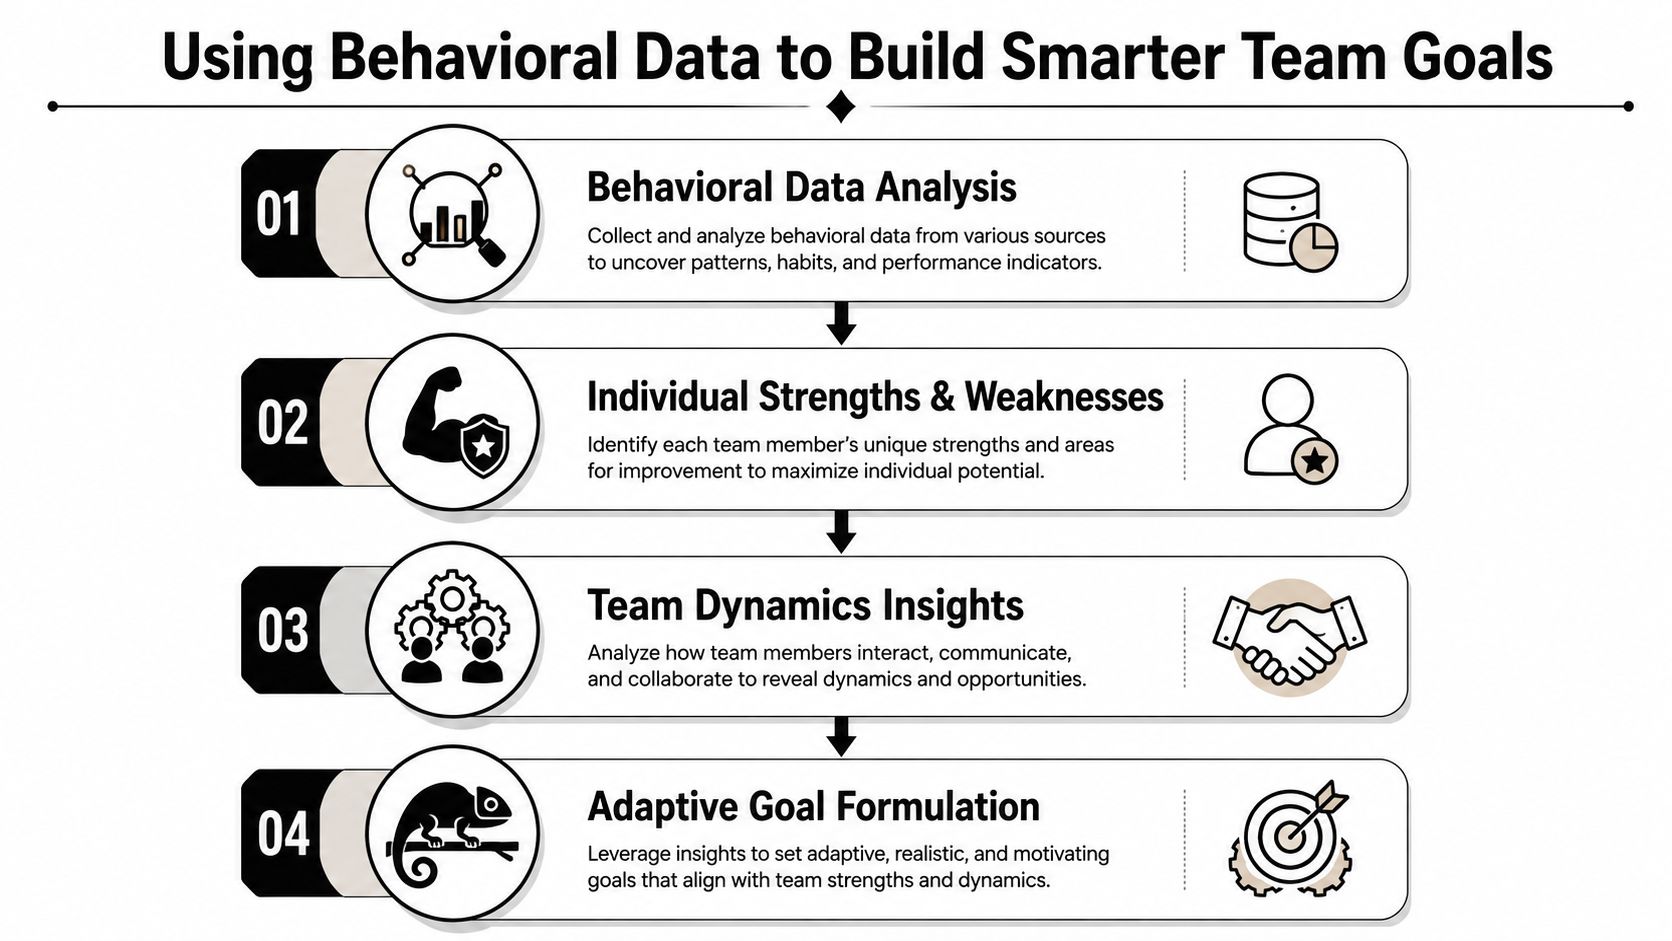
The useful insight here is that goal quality depends on execution context. Two teams can receive the same objective and produce very different results because their internal dynamics differ. Behavioral assessment doesn't replace design judgment, but it gives leadership a sharper way to assign ownership, forecast risk, and choose the right support for the goal.
Common Pitfalls and How to Avoid Them
I've watched design teams miss their own goals in predictable ways. The frustrating part is that many of those teams were still productive, still shipping, and still viewed as busy. They just weren't making the kind of progress that changes decisions.
The first trap is overload. Teams choose too many priorities, then wonder why none of them moves. The fix is uncomfortable but straightforward. Keep the set small, make the trade-offs visible, and force every new request to compete for the same attention.
The second trap is measuring output instead of outcomes. A team can close tickets, produce screens, and keep pace with requests while the actual user experience gets worse. Better goals start with the change you expect in behavior or business signal, then tie the work to that change before execution begins.
What gets missed most often
> A design team can hit every productivity target and still fail the users who are easiest to overlook.
Inclusion has to be built into the goal set. Many goal-setting guides leave out underserved users, and that omission creates avoidable risk. Teams should connect accessibility, demographic coverage, and inclusive feedback loops to the goal itself, not treat them as a separate workstream. Research and practitioner writing on underserved communities emphasizes direct research, early involvement of affected users, and co-design that addresses structural barriers instead of assuming one-size-fits-all solutions ([UX Magazine](https://uxmag.com/articles/designing-the-block-how-ux-can-improve-underserved-communities)).
Goal setting also breaks down when the team has no clear operating rhythm. As organizations grow, ad hoc alignment gets harder to sustain, so reviews need a cadence and a visible owner rather than a loose quarterly conversation. That structure matters because design goals have to hold up across product, research, engineering, and leadership, not just inside the design group.
Your Design Team Goals Action Plan
The fastest way to make this real is to run a one-page working session with your team this week. Write each goal with three fields, baseline, target, and metric, then ask stakeholders whether the goal would change a business decision if it moved. If the answer is no, it probably isn't the right goal.
Here's the template I'd use:
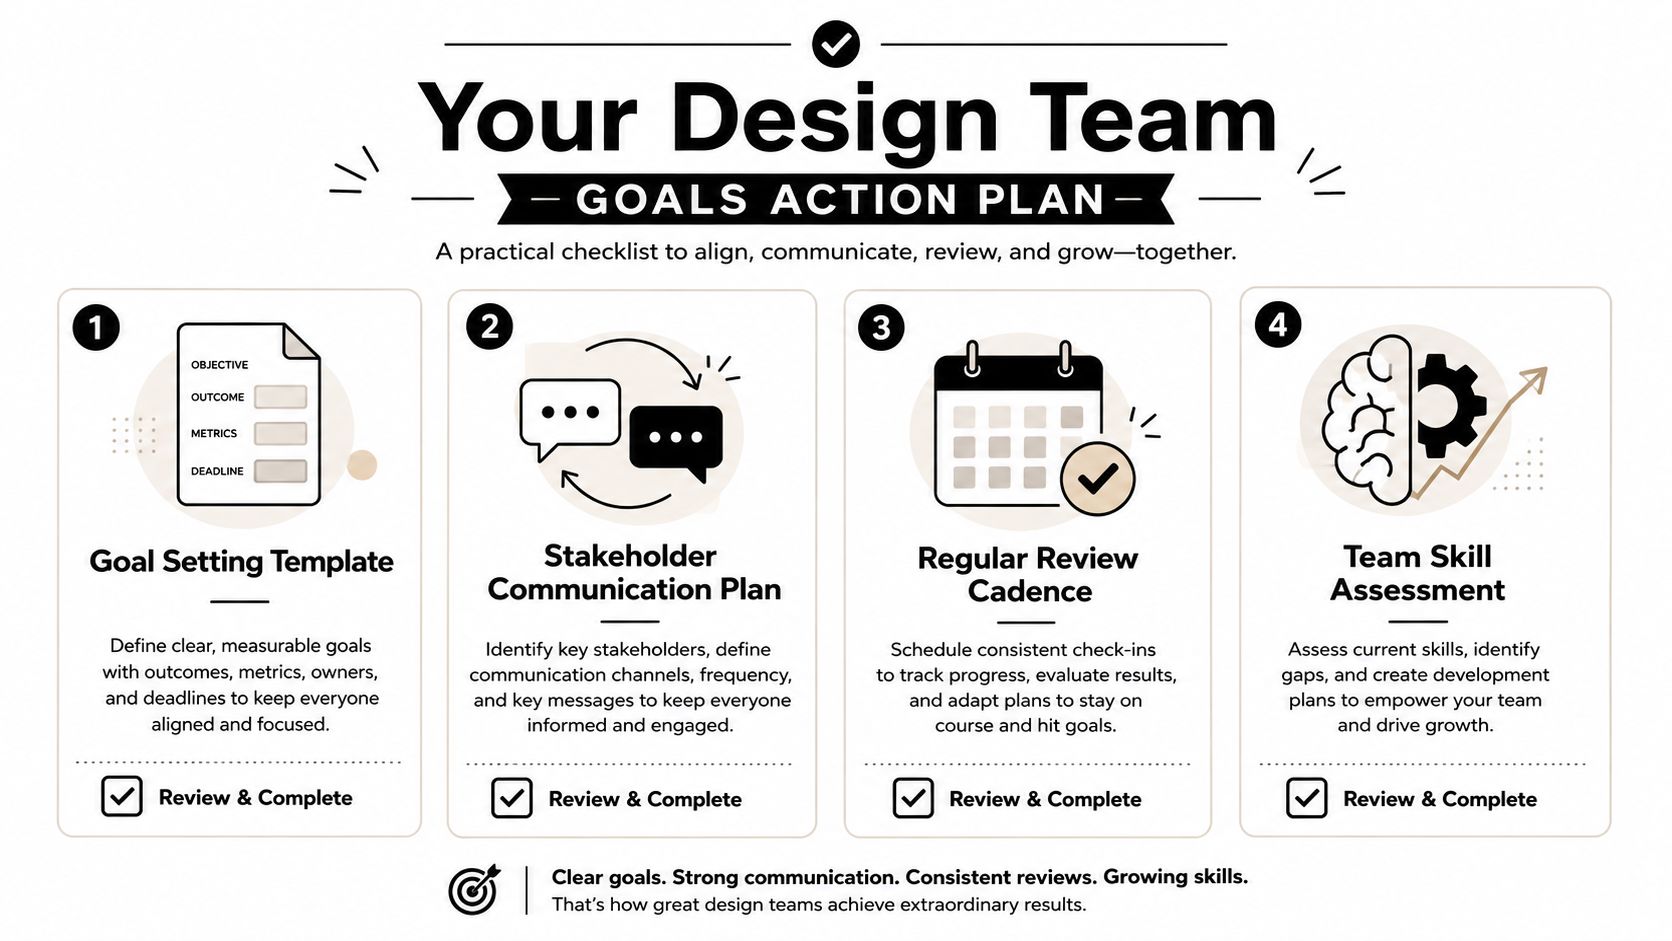
A quarterly review should answer three questions. Did the goal move the intended metric? Did the team learn something that changes the goal? Did the goal still matter to the business? If two of those answers are no, retire it or rewrite it.
Synopsix helps teams bring behavioral assessment, compatibility analysis, and predictive simulations into the goal-setting process, so ownership and execution fit the people doing the work. If you want to connect design goals with team dynamics and decision quality, visit [Synopsix](https://synopsix.ai) and see how its people intelligence tools can support more grounded planning.