How to Reduce Hiring Costs Without Hiring Worse
By Synopsix · November 10, 2026 · 17 min read
In 2025, the average cost per hire for nonexecutive roles in the United States was $5,475, according to [SHRM's 2025 U.S. benchmarking reports](https://www.shrm.org/about/press-room/shrm-releases-2025-benchmarking-reports--how-does-your-organizat). That number is the recruiting invoice. It leaves out vacancy days, weak fit, and an exit that reopens the requisition.
A lower job-board rate can still raise total cost if the hire leaves early or the seat stays open longer. How to reduce hiring costs means scoring each cut by that full ledger, so a saving this month does not reappear later as lost output and a second search. Finance will accept the model that shows which roles create repeat spend, not the one that only discounts the visible line.
Calculate Your True Cost per Hire
Many teams can tell you what a job ad costs. Far fewer can tell you what one hire costs once recruiter time, manager interviews, vacancy days, and early attrition are included. That gap explains why cost cutting so often disappoints. You remove a visible expense, the process slows down or quality drops, and the saving reappears later as overtime, lost output, or a reopened requisition.
Build the model before you change tactics. Use a simple formula consistently: cost per hire equals internal recruiting costs plus external recruiting costs, divided by total hires. Then add two lines many teams leave out, vacancy cost and early attrition cost, because those lines reveal whether a faster or cheaper hire was less costly for the business.
Build the Model Row by Row
| Cost component | Where it shows up | How to measure | |---|---|---| | External spend | Job ads, agency fees, assessments, background checks | Invoices tagged by requisition | | Recruiter time | Sourcing, screening, scheduling | Logged hours per requisition times loaded hourly rate | | Hiring-manager time | Interviews, debriefs, offer decisions | Calendar hours per candidate stage | | Vacancy cost | Lost output while the seat stays open | Days open times the daily value of the role | | Early attrition | Hires who leave within 90 days | Exits within 90 days times fully loaded replacement cost | | Onboarding preparation | Equipment, training, ramp-up time | Onboarding hours and tools per hire |
Tag every invoice to a requisition from day one. If agency fees, assessments, and advertising sit in a general HR bucket, you can't compare channels or role families, and you'll end up cutting the easiest line to see rather than the largest leak.
For internal time, don't chase false precision. Use logged recruiter hours where you have them, calendar hours for managers, and a loaded hourly rate that finance agrees in advance. A directional number that's applied consistently beats a perfect number nobody trusts.
Use a Benchmark, Then Localize It
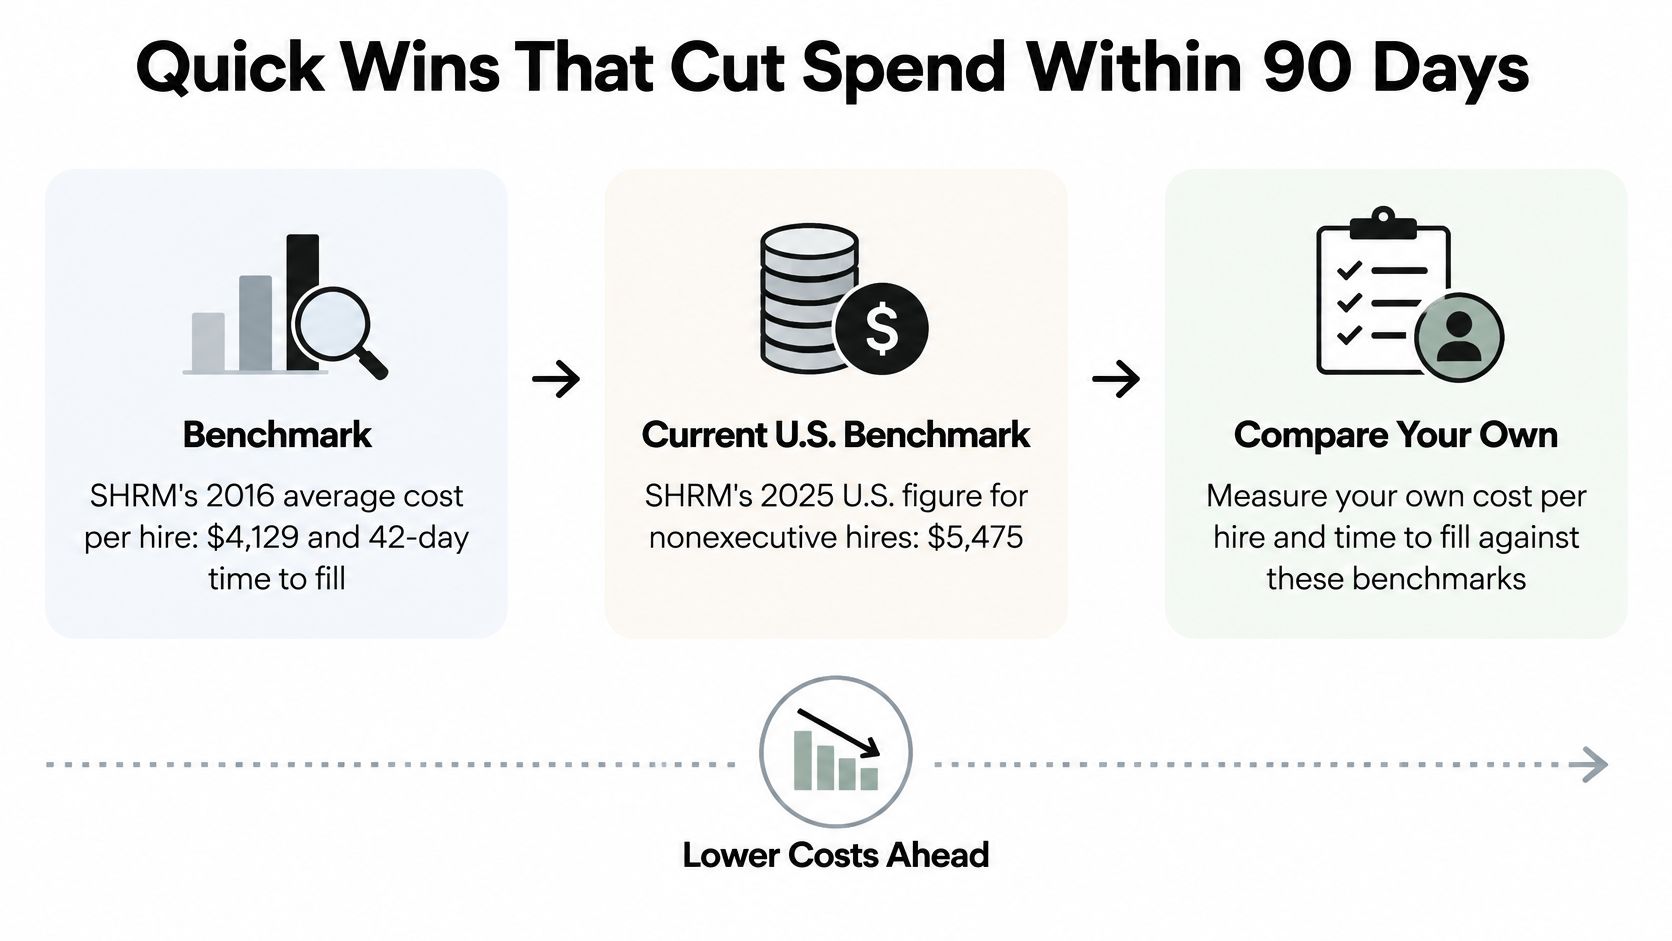
You need an external anchor while your internal data matures. In [SHRM's 2016 Human Capital Benchmarking Report](https://www.shrm.org/topics-tools/news/shrm-benchmarking-report-4129-average-cost-per-hire), based on fiscal-year 2015 data from a random sample of 2,048 SHRM members, the average cost per hire was $4,129 and the average time to fill a position was 42 days.
Run that math on a modest hiring plan. At 100 hires a year, $4,129 per hire equals about $412,900 in direct spend before internal labor or vacancy losses. A 20% reduction against that baseline would save roughly $82,580 a year. Shortening a 42 day cycle by even one week also matters, because fewer open days mean less lost output and fewer candidates lost to faster competitors.
> Practical rule: Treat the benchmark as a starting ruler, not your target. Your own segmented cost is the number you manage.
Segment Before You Cut
Don't report one blended cost per hire and call it insight. Segment by role family, seniority, channel, geography, and hiring manager, then compare each segment with time to fill and early tenure retention.
That segmentation changes the decision. Say two channels produce hires at similar upfront cost, but one produces far more exits in the first 90 days. The second channel isn't equally efficient. It's creating replacement requisitions. Likewise, a manager whose interviews stretch for weeks may be adding vacancy cost that never appears on an invoice.
Once you've segmented the model, rank the leaks by size. Agency dependence in one role family, slow scheduling in another, and early attrition in a third each need a different fix. That's how you reduce hiring costs without guessing.
Quick Wins That Cut Spend Within 90 Days
Quick wins work only if they're aimed at the right role economics. SHRM's 2025 U.S. benchmark reported average cost per hire of $5,475 for nonexecutive positions and $35,879 for executive positions, making executive recruiting nearly seven times more expensive. Use high touch sourcing and structured approval gates for executive searches. Use scalable direct sourcing and referrals for repeatable nonexecutive roles.
Six Moves for the Next 90 Days
1. Run a funnel diagnostic. Measure applicants per qualified candidate, screen to interview conversion, interview to offer conversion, offer acceptance, time to fill, and 90 day failure rate. It shows where money leaks. The common slip is ranking channels by cost per applicant alone, which rewards volume over finalists. 2. Cut high cost, low conversion channels. Move spend to sources that produce finalists and accepted offers. Don't cut sourcing if vacancy days then grow. That's a false saving. 3. Standardize intake. Use one job scorecard and one approval path per role family so requisitions don't reopen halfway through. Don't copy one scorecard across unlike roles. You'll screen for the wrong things faster. 4. Batch structured interviews. Use the same questions and scoring rubric, booked in one batch, so scheduling speeds up without losing comparability. The slip is skipping rubric calibration, leaving each interviewer to score on private standards. 5. Set an agency fee ceiling. Require approval above it because contingency fees scale with salary. Don't exempt senior searches from review. They're exactly where fees need a gate. 6. Review quality of hire quarterly. A cheap hire who leaves early is expensive. Don't report only averages. Use medians and role level distributions because outliers distort averages, especially when executive searches sit in the same report as frontline hiring.
If you're a smaller company formalizing cost discipline for the first time, [a founder's guide to managing expenses](https://useshiny.com/blog/cost-reduction-strategies/) from Shiny is a useful companion for deciding which operating costs to challenge first and which to protect.
Sequence matters. Baseline first, remove weak channels second, standardize intake and scheduling third, then tighten agency rules. If you reverse that order, you'll negotiate fees on a process that's still wasting interviews.
Sourcing Channels That Lower Replacement Costs
A sourcing channel earns its place when its full cost is lower, including the expense of replacing hires who leave early and the cost of keeping a role vacant. Compare channels within each role family: the same source can perform differently for frontline, specialist, and leadership positions.
| Channel | Upfront cost | Best used for | |---|---|---| | Employee referrals | Low, mostly the incentive bonus | Repeatable nonexecutive roles | | Job boards | Per-posting or sponsored fees | High-volume frontline roles | | Recruitment agencies | Contingency fees, often a share of first-year salary | Scarce roles that pass an approval gate | | Direct sourcing | Recruiter time and tool costs | Niche roles with known talent pools | | Internal mobility | Coaching and onboarding time | Roles where current staff already fit |
Why Referrals Change the Math
A [2018 analysis citing referral-hiring research](https://www.icims.com/blog/how-employee-referrals-impact-retention/) reported that 50% of referral hires remained employed for at least 38 months, compared with 22 months for non-referral hires. The analysis also estimated a 41% reduction in future backfilling costs. That estimate covers the lower frequency of recruiting, posting, agency, evaluation, onboarding, and training expenses; it is not a percentage reduction in cost per hire.
A referral bonus may therefore be worth paying even when a job-board posting costs less upfront. Judge the program on retention and replacement costs, not the bonus or application volume alone.
Guard against lower-quality referrals as volume rises, and monitor whether referral networks narrow representation. Track referral share, conversion, performance, retention at 6 and 12 months, and representation across demographic groups. A [talent acquisition strategy](https://synopsix.ai/blog/talent-acquisition-strategy) should set those measures before referral volume scales.
Test Referrals Like an Investment
Record baseline attrition, time to fill, cost per hire, referral volume, and 90-day retention by location and job family. Introduce the program randomly or stagger its launch across comparable teams, keeping eligibility and communication consistent. Compare treated and control groups for at least 12 to 13 months.
In [a randomized study in a large grocery chain](https://www.nber.org/system/files/working_papers/w25920/revisions/w25920.rev1.pdf), an employee referral program reduced attrition by 15 to 20% over 13 months and lowered labor costs by up to 2.8%. Referred workers had 40% lower attrition than observably similar non-referrals. About 5% of the financial benefit came directly from referred hires; roughly 95% came from improved retention among non-referred employees.
> Judging a referral program only on referred-hire retention understates its return. Employees who help shape who joins may stay longer themselves.
Choose channels by role family and total replacement cost. Referrals and internal mobility suit repeatable roles with strong internal networks. Reserve agencies for scarce roles that pass an approval gate, and assess job boards by conversion rather than traffic.
Assessments That Prevent Costly Mis-Hires
Treating an assessment as pure added cost gets the causality backwards. The relevant question isn't what the assessment costs. It's what a weak shortlist, wasted interview rounds, and a mis-hire cost when the role has to be filled again.
The image below shows the practical shift, from reading resumes in isolation to reviewing a comparable candidate profile.

What the Evidence Actually Supports
A [large meta-analytic review of personality assessments](https://onlinelibrary.wiley.com/doi/abs/10.1111/j.1744-6570.1991.tb00696.x) examined 494 studies and identified 97 independent samples totaling 13,521 participants. The corrected mean validity was 0.29 for studies using confirmatory research methods, compared with 0.12 for exploratory studies. When researchers explicitly used job analysis to select the personality measures, mean validity increased to 0.38.
That spread is the buying lesson. Generic personality testing offers weaker evidence. Role specific prediction, tied to documented job requirements, is where assessment spend can reduce wasted interviews and selection errors. If you're comparing tools, a disciplined [hiring assessment test](https://synopsix.ai/blog/hiring-assessment-test) should explain which behaviors it measures, why they matter for the role, and how scores connect to observable outcomes.
In our selection and hiring analysis, we evaluate a candidate against the role, team, leader and culture, predict integration risk and propose questions for the final interview. That keeps the assessment tied to the actual hiring decision rather than turning it into a standalone report nobody uses.
The short video below is useful context before you build your own checklist.
<iframe width="100%" style="aspect-ratio: 16 / 9;" src="https://www.youtube.com/embed/Dt6sefbuMXs" frameborder="0" allow="autoplay; encrypted-media" allowfullscreen></iframe>
A Five Point Validation Checklist
1. Tie each trait to a job requirement. If you can't name the work behavior it predicts, don't measure it. 2. Ask for role specific validation evidence. General accuracy claims don't prove the tool works for your sales managers, nurses, or supervisors. 3. Check observable behavior. The measure should reflect job behaviors or work products, not broad character judgments. 4. Monitor group level results. Review outcomes for adverse impact before a pattern becomes a legal and reputational problem. 5. Refresh validity on a schedule. Roles change, and old evidence can stop describing the job you have now.
Those checks align with [EEOC employment testing guidance](https://www.eeoc.gov/laws/guidance/employment-tests-and-selection-procedures), which identifies three accepted validation strategies under the Uniform Guidelines: criterion-related validation, content validation, and construct validation. The employer remains responsible for ensuring a vendor's documentation fits the position and purpose.
Now run the cost test. Compare the assessment fee with avoided replacement cost and wasted interview hours. In an executive role, where replacement costs sit far above a nonexecutive average, preventing one mis-hire can justify assessment spend across many requisitions. In a low risk, high volume role, use lighter screening and reserve deeper analysis for finalists.
Automating Screening Without Filtering Out Good Candidates
[SHRM's reporting on Appcast analysis](https://www.shrm.org/topics-tools/news/talent-acquisition/hiring-costs-rising-cooling-labor-market) of more than 302 million clicks, 27 million applications, and nearly 1,200 employers found that both cost per application and cost per hire rose even as hiring demand softened and application volumes increased. More applicants did not buy a cheaper hire. The extra volume landed later as recruiter cleanup, longer vacancy time, and replacements when the wrong person got through.
Automation saves money when it removes repetitive administration and captures comparable information early. It raises total cost when it rejects strong candidates, creates false positives for recruiters to clean up, or pushes applicants to drop out. A week saved in screening is a loss if the seat stays empty or the new hire leaves inside 90 days.
Walk the Funnel Stage by Stage
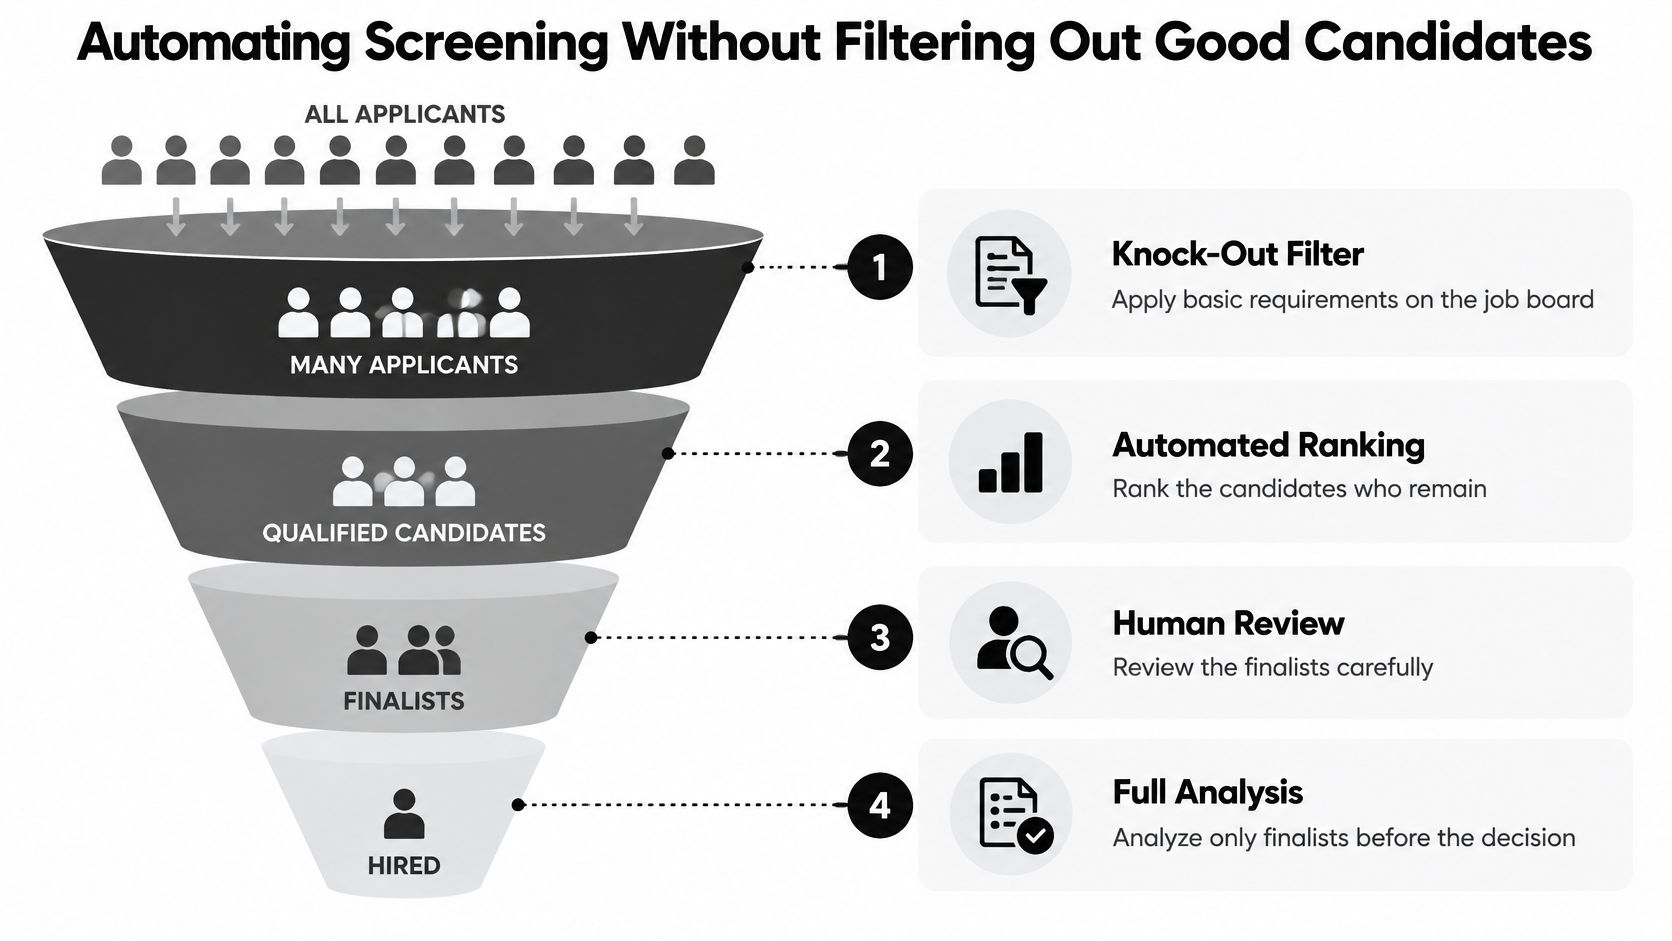
Screen follows that logic in five steps: define the vacancy, publish it on your own job board, have AI rank every applicant, run full analysis only on finalists, and close with an AI Decision. Knock-out questions on that job board filter applicants before ranking begins.
Humans stay in charge of job analysis, exceptions, candidate communication, fairness checks, and final trade-offs. Those controls stop a fast filter from making expensive mistakes at scale.
Speed Is a Weak Success Metric
Recruiters often report that AI makes screening faster. That only says the queue moved. It does not say whether hires performed better, stayed longer, or cost less once vacancy days and early attrition are included.
More applications can mean more false positives, more governance, more human review of automated recommendations, and more candidate drop-off if the process feels opaque. The tool fee is visible. The cleanup work is not, and neither is the open role that sits unfilled while a good applicant walks away.
Do not adopt a vendor dashboard as the scorecard. Compare screening models on cost per qualified finalist, cost per accepted offer, quality-adjusted cost per hire, and adverse-impact indicators at each funnel stage. A faster model that produces weaker finalists shifts the bill into interviews, open seats, and replacements.
KPIs and ROI Model Finance Will Accept
Finance won't fund a hiring efficiency program on recruiter anecdotes. Give them metrics they can audit, definitions that don't change mid quarter, and a decision rule for stopping what doesn't work.
| Metric | How to calculate | Review cadence | |---|---|---| | Cost per hire | (Internal + external recruiting cost) ÷ total hires | Monthly | | Time to fill | Days from requisition approval to accepted offer | Monthly | | Cost per qualified finalist | Total screening cost ÷ finalists advanced | Quarterly | | Six- and twelve-month retention | Share of hires still employed at each point | Quarterly | | Quality-adjusted cost per hire | Cost per hire ÷ share of hires meeting the performance bar at six months | Quarterly | | Early attrition cost | Exits within 90 days × fully loaded replacement cost | Quarterly |
The ROI Logic
Keep the model plain. Savings equal the drop in cost per hire times hires, plus avoided early attrition cost, minus program cost. Program cost includes bonuses, tool fees, assessments, and administration. Avoided attrition cost should use fully loaded replacement cost, including manager interview time, onboarding, vacancy days, and lost productivity.
Seniority changes the stakes, so don't model every role as if it carries the same replacement risk. [CIPD's 2026 resource and talent planning findings](https://www.cipd.org/globalassets/media/knowledge/knowledge-hub/reports/2026-pdfs/9218-resource-and-talent-planning-2026-report-web.pdf) report median recruitment costs of £2,000 for employees and £3,500 for senior managers. Your local figures will differ, but the structure won't. Higher seniority usually means higher direct cost and higher cost when the hire fails.
A useful [recruitment efficiency metrics](https://synopsix.ai/blog/recruitment-efficiency-metrics) dashboard therefore pairs cost with durability. Compare channels on six and twelve month retention, ramp time, manager satisfaction, and performance, not applications or placements alone.
> Decision rule: If quality-adjusted retention does not improve after the test window, stop or redesign the program. Don't keep funding faster disappointment.
Report Medians, Not Just Averages
One executive search can distort a quarter's average and make a healthy frontline process look broken. Segment by role family and seniority, report medians alongside averages, and show the distribution when a number moves sharply.
Assign one owner per metric and review the dashboard quarterly with finance, talent acquisition, and hiring managers in the same room. Each review should end with a decision: scale, fix, or stop. A KPI that never changes a decision is reporting decoration.
That's the test of how to reduce hiring costs in a way finance accepts. You're not claiming hiring got cheaper because spend moved off one invoice. You're showing that total cost fell while retention and performance held.
Roll Out a 90-Day Pilot With Stakeholder Buy-In
Don't announce a company wide transformation. Run one pilot small enough to control, important enough to matter, and scheduled for a decision on a fixed date. Synopsix can deliver a defensible hiring call in under 48 hours, but speed only helps if stakeholders agree in advance what evidence will count.
Who Must Agree Before You Start
Keep the pilot small, fix the review date in advance, and share results with managers before scaling. That's the change management discipline that prevents a useful test from turning into a turf dispute.
The 90 Day Sequence
1. Pick one high volume nonexecutive role with steady demand. You need enough hires to learn something, without betting the whole hiring plan on an unproven process. 2. Record an eight to twelve week baseline. Capture cost per hire, time to fill, cost per qualified finalist, and 90 day retention before you change anything. 3. Change one or two levers only. Try standardized intake with knock-out screening, or one referral variant, so you can attribute the result. 4. Keep a comparable control. Hold one similar role or location on the current process for comparison. 5. Review at day 90 with complete data. Bring adverse impact results and hiring manager feedback, not just cost per hire. 6. Scale only on quality adjusted improvement. Expand if quality-adjusted cost per hire improves and retention holds. Otherwise redesign first.
Set stop rules before launch. Halt the test if candidate drop-off rises sharply or adverse impact appears. Continuing a flawed pilot to save face costs more than stopping it, because every additional requisition repeats the same filtering error.
Watch the failure modes that don't show up in spend reports. Managers may bypass the scorecard for urgent hires. Recruiters may keep a shadow spreadsheet if the new workflow adds clicks. Candidates may abandon knock-out questions that feel irrelevant. Name those risks in the kickoff and assign someone to check them weekly.
Your first decision this quarter isn't which tool to buy or which channel to cut. It's which single role gets the pilot. Pick that role, lock the baseline, and let the numbers argue for scale.
---
If you're ready to judge hiring spend by fit and durability, not just application volume, Synopsix helps you evaluate candidates against the role, team, leader, and culture before you make an offer. Use that evidence to cut wasted interviews, surface integration risk early, and lower the total cost of each hire. Visit [Synopsix](https://synopsix.ai) to see how a defensible hiring decision can move faster without getting weaker.