Leadership Assessment Report: Parts and How to Read Them
By Synopsix · October 25, 2026 · 19 min read
Most advice tells you to look for a clear verdict in a leadership assessment report. You're told to find the score, check whether it's high enough, and move on. That's the wrong way to read one.
A good report doesn't give you a grade. It gives you evidence you have to weigh. Some parts predict future performance reasonably well. Others only describe how a person tends to work, or how a team experiences them right now. If you treat all of it as equally strong proof, you'll promote the wrong person with great confidence.
Think of yourself as someone inspecting the evidence, not accepting a conclusion. That's a slower job, but it's the job that protects you.
What a Leadership Assessment Report Contains
A leadership assessment report is a structured set of evidence, not a verdict. It works best when you read it as a map rather than a grade, because each part answers a different question and none of them answers the whole question alone.
The method has old roots. Assessment centers were first used to select World War II officers, and they were systematically studied in a 1987 meta-analysis by Gaugler, Rosenthal, Thornton and Bentson, whose validity figures appear in the evidence table later in this article.
Use a car inspection as your mental model. The engine score, the test drive notes, the warning lights and the mileage history each tell you something different. A clean engine score doesn't cancel a warning light, and a good test drive doesn't prove the brakes will hold on a long hill.
The Six Components You Should Expect
| Component | What It Measures | Typical Format | Decision It Informs | |---|---|---|---| | Competency scores | Rated leadership competencies such as decision quality, execution and people development | Score bands tied to a rating rubric | Readiness for the next role | | Behavioral profile | Observable working style, such as how the leader handles conflict and pressure | Narrative with style indicators | Team fit and coaching focus | | Risk indicators | Patterns linked to derailment, such as abrasive conduct or avoiding hard decisions | Flags with confidence levels | Whether to pause a move or add support | | Stakeholder feedback | How self, manager, peers and direct reports rate the leader | Rater-group comparisons with spread shown | Gaps between self-view and team experience | | Development plan | Specific behaviors to change, with measures and a review date | Action list with timeline | What to practice over the next 90 days | | Evidence and confidence notes | Sources used, missing data and limits of each finding | Short annotations per finding | How much weight each finding deserves |
Competency scores tell you whether the leader has shown the skills the next role needs, so they feed a readiness decision. A behavioral profile describes how the person typically works under pressure, so it feeds team fit and coaching choices.
Risk indicators flag patterns that can derail a leader, so they feed a decision about timing and support. Stakeholder feedback shows how different groups experience the leader, so it feeds your view of self-awareness and daily impact.
The development plan turns findings into observable behaviors to practice. The evidence and confidence notes tell you what's behind every claim, and they matter most when you're unsure how much to trust a finding.
> If you read only one component, you don't have a weaker version of the truth. You have a different, and usually misleading, story.
The sections that follow explain how to weigh each part, where readers usually over-trust a number, and where a weak signal can still be useful if you label it candidly.
Why Structured Evidence Outweighs Impressions
A confident executive's impression can be wrong. In a leadership assessment, structured, behaviorally anchored evidence gives you a clearer basis for comparison because the criteria are set before candidates are rated.
A structured interview works like a test with a fixed protocol: candidates answer the same questions, follow the same probing rules and are scored against the same anchors. An unstructured conversation may feel revealing, but its questions and judgments can shift from one interviewer to another. The difference is like comparing measurements taken with the same ruler against estimates made by different people.
What the Validity Numbers Actually Mean
Validity figures describe how closely an assessment measure is associated with later job performance or potential. They help compare evidence types, but they do not predict an individual's outcome with certainty. [AESC's overview of leadership assessment](https://www.aesc.co.in/insights/leadership-assessment/) discusses structured assessment and selection practices, but the specific interview-validity figures sometimes repeated in summaries are not supported here by a named original study. Without that source, those figures should not be treated as established facts.
| Evidence Source | Validity Reference | What It Means for a Report | |---|---|---| | Structured interview | No coefficient stated here | Fixed questions and scoring anchors make candidates easier to compare | | Unstructured interview | No coefficient stated here | Interviewer judgment can vary, so impressions need careful corroboration | | Years of experience | No coefficient stated here | Tenure alone does not show how someone will lead in a demanding situation | | Assessment center | A 1987 meta-analysis reported 0.37 for job performance and 0.53 for future potential | Multiple exercises across situations provide different evidence for current performance and potential |
The assessment-center values are described in the [Hogan Assessments encyclopedia chapter on assessment centers](http://www.hoganassessments.com/sites/default/files/uploads/Encyclopedia.pdf). Keep the two outcomes distinct: evidence associated with future potential does not make the same claim as evidence associated with current job performance. A report should say which outcome each finding is intended to inform.
Standardization offers one reasonable interpretation of why structured methods may support fairer comparisons. Shared questions and scoring anchors put candidates on more comparable ground and may reduce room for irrelevant preferences to shape a rating. That is an explanation of how the process can help, not proof that structure alone guarantees a sound decision. Experience, meanwhile, records time spent in work. It does not show what the person did when the work became difficult.
The Caveat That Keeps You Honest
Study results vary. The credibility interval reported for structured interviews ranged from 0.18 to 0.66, reflecting variation across studies. That range does not, on its own, establish what caused the differences or show that implementation quality was responsible.
The report itself needs to show enough detail for you to judge the evidence. Check each competency for:
> Practical rule: If a score cannot be traced to observed behavior, give it little weight, however precise it looks on the page.
A useful report also distinguishes predictive indicators from descriptive traits and flags conclusions based only on self-report. That distinction makes the recommendation easier to audit. A hiring manager can see how the evidence bears on decision areas such as execution, conflict management or people development, instead of being asked to trust a number without knowing what supports it.
Reading Behavioral Profiles Against Role Demands
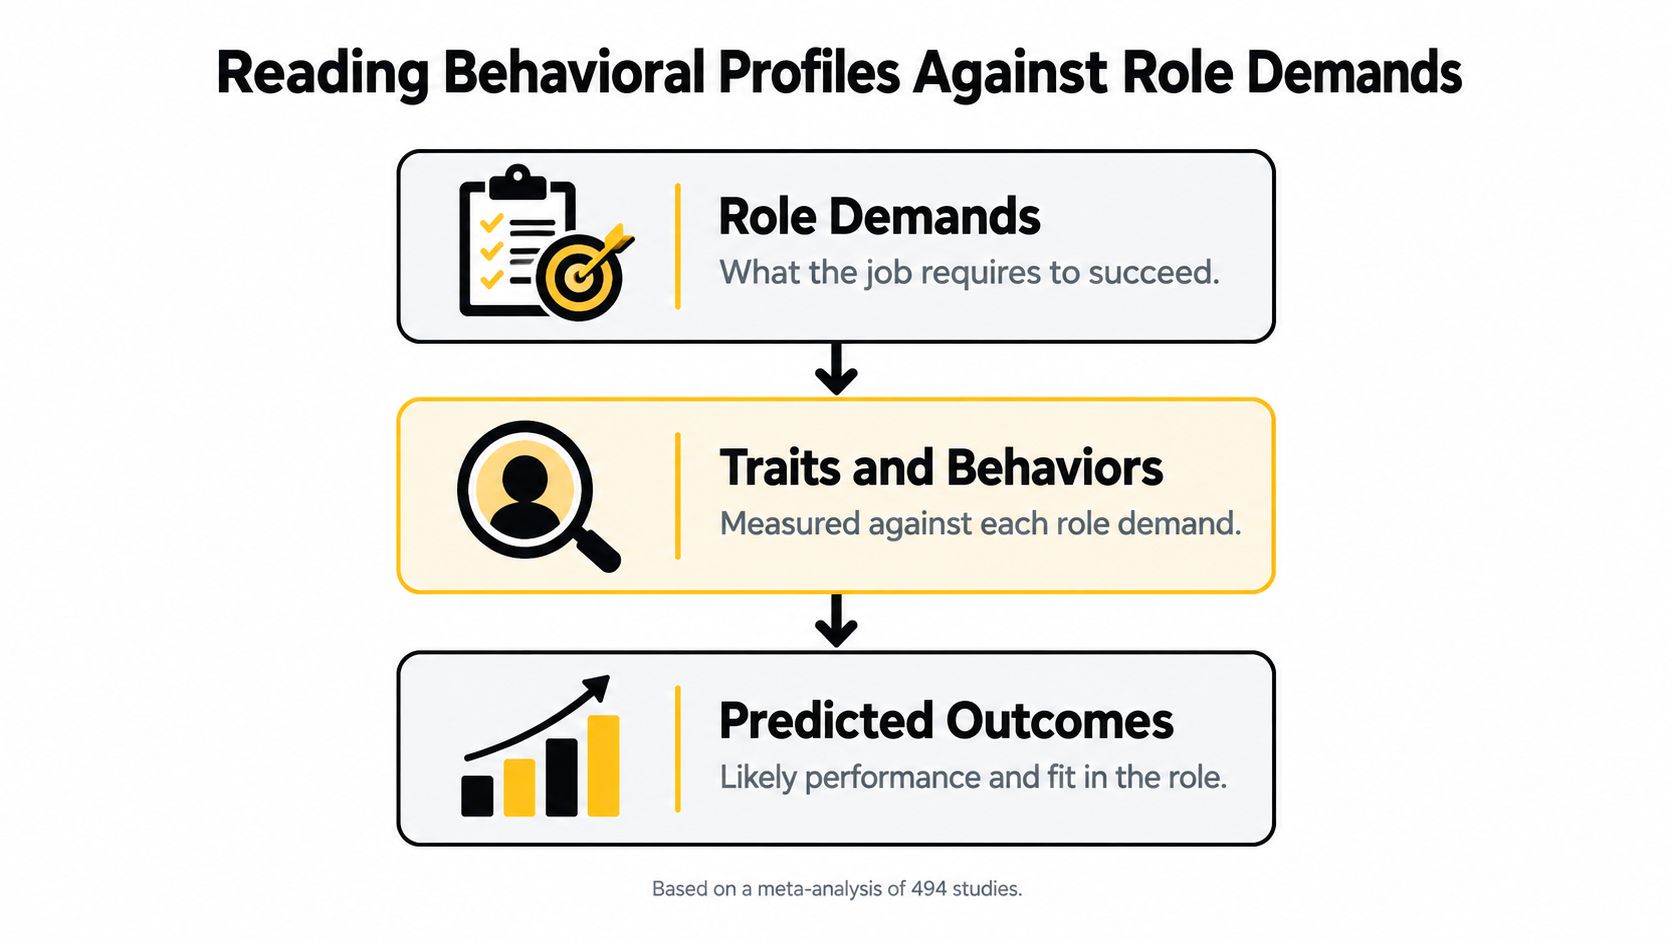
A behavioral profile is useful only when read against the work the person must do. Start with role demands, then examine the measured traits and behaviors, and finally consider possible outcomes. The order matters: a trait can look like a strength in one role and create friction in another.
Why Job Analysis Changes the Math
A meta-analysis of 494 studies, 97 independent samples and 13,521 participants found that personality measures predicted job performance with a corrected mean validity of 0.29. The figure rose to 0.38 when researchers used job analysis to select measures, compared with 0.12 in exploratory studies, according to [the Personnel Psychology meta-analysis of personality and job performance](https://onlinelibrary.wiley.com/doi/abs/10.1111/j.1744-6570.1991.tb00696.x).
The practical lesson is that a generic personality inventory may offer weak evidence if no one has first defined the work. Job analysis gives assessors a map: it helps them select measures tied to the role's actual demands. For example, a competency profile for a leader managing cross-functional work should reflect the behaviors that work requires, rather than an abstract picture of an “ideal” leader.
Check whether the report's competencies were developed for the target role. This guide explains [how to assess leadership competencies against a specific role](https://synopsix.ai/blog/how-to-assess-leadership-competencies).
Read Traits One at a Time
Avoid reducing the profile to a single ideal-leader score. Each trait describes a different tendency, and its relevance depends on the role. Read each one alongside observable behavior: what did the person do, in what situation, and how does that behavior connect to a stated job demand?
<iframe width="100%" style="aspect-ratio: 16 / 9;" src="https://www.youtube.com/embed/fO36lASJqGU" frameborder="0" allow="autoplay; encrypted-media" allowfullscreen></iframe>
A separate meta-analysis examined leadership emergence in leaderless groups. It reported that four Big Five traits, neuroticism, extraversion, openness to experience and conscientiousness, jointly predicted who emerged as a leader with a multiple correlation of 0.48 ([a meta-analysis of leadership emergence in leaderless groups](https://www.sciencedirect.com/science/article/abs/pii/S0191886911002479)). The result concerns emergence in groups without an appointed leader. It does not establish that someone will lead effectively once in the role.
That distinction is easy to miss. Being recognized as a leader is like being chosen to captain a team; it does not, by itself, show how well the person will guide the team through difficult decisions. A profile also cannot establish whether colleagues will trust the leader, whether a strategy is sound, or whether behavior will hold under pressure. Those questions require other evidence.
Weighing Self, Manager, Peer and Team Ratings
A leadership report can collect many ratings and still offer a partial view. Each rater sees the leader from a different vantage point, like people watching the same game from separate seats. The ratings are useful evidence, especially for development, but they do not prove decision quality or predict future performance on their own.
Employee surveys are one way organizations gather views of leadership. Their value depends on what they ask, who responds, and how the results are interpreted. A survey can show how people experience a leader; it cannot, by itself, establish whether the leader's decisions were sound or whether strong performance will continue. A well-liked leader may still make poor calls.
How Each Rater Source Differs
| Rater Source | Main Strength | Typical Blind Spot | How to Read It | |---|---|---|---| | Self-rating | Shows intent and self-awareness | May be more favorable than others' views | Compare against other ratings; treat a large gap as a development topic | | Manager rating | Sees results and priorities | May reflect the relationship as well as observed behavior | Check against peer and team patterns | | Peer rating | Sees cross-functional collaboration | Has limited view of authority and decisions | Look for themes repeated across peers | | Direct-report rating | Experiences daily leadership behavior | May be affected by power dynamics and recent events | Consider whether the pattern holds over time |
Each group sees a different part of the job. Direct reports can describe whether feedback feels safe. Peers can speak to how the leader shares credit across functions. A manager can assess whether priorities were delivered. No single group sees the whole picture.
A [guide to how a 360 assessment for leadership is set up and interpreted](https://synopsix.ai/blog/360-assessment-for-leadership) can help clarify how these perspectives are gathered. The report should also show how responses were grouped and what conclusions the evidence can support.
What Makes Ratings Usable
Before acting on stakeholder scores, check three details:
> A repeated pattern across independent rater groups is stronger evidence than a single extreme score from one group.
Consider a leader who rates their own listening highly, while the team gives a lower rating. That gap does not establish that the leader lacks self-awareness or that the team's view is definitive. It signals that the leader's intent and the team's experience may differ. Ask for specific examples, then check whether the same pattern appears across raters and over time.
Keep developmental feedback and career decisions distinct where possible. If people know their ratings will affect a promotion, they may respond differently. When ratings must inform a high-stakes decision, explain that use in advance, show how the evidence was weighed, and avoid treating a developmental score as if it were a precise measure of future performance.
Turning Report Patterns Into Promotion and Development Decisions
A finding only matters once it changes what your organization does next. Until then it's interesting information sitting in a file. That is the test a leadership assessment report must pass to justify its cost.
Six Patterns and What They Support
| Report Pattern | Promotion Read | Development Read | |---|---|---| | Strong competencies, consistent across all raters | Ready for the next level if role demands match | Build stretch work in the same strength | | Strong self-rating, weak direct-report ratings | Pause; team experience does not yet match | Targeted feedback on daily behavior, rechecked at 90 days | | High results with a high-confidence risk flag | Promote only with a defined support plan | Coach the flagged pattern before expanding scope | | One extreme score from a single rater group | Do not decide on it | Verify with more raters before acting | | Risk flag with low confidence or missing evidence | Gather more evidence first | Re-assess before setting development focus | | Scores that differ across cultures or markets | Compare within local norms | Read trait results against local leadership expectations |
Walk through the rows slowly. Strong competencies with consistent ratings support a promotion only if those competencies match the next role's demands. Strength in the current job is not automatically strength at the next level.
A strong self-rating with weak direct-report ratings should pause you. The team isn't experiencing what the leader believes they're delivering, and a bigger team will usually amplify that gap rather than fix it. Set a short development focus on daily behavior and recheck it.
High results with a high-confidence risk flag is the pattern executives most often rationalize away. Revenue or delivery numbers can look fine while abrasive conduct or decision avoidance steadily raises the cost of the team. Promotion can still happen, but only with a defined support plan and coaching on the flagged pattern before scope expands.
One extreme score from a single rater group shouldn't decide anything. Verify it. The same logic applies to a risk flag with low confidence or missing evidence. Gathering more evidence feels slow, but acting on a guess is slower once you have to undo it.
Culture Changes What a Trait Score Means
Don't read the same trait score identically across markets. A cross-cultural review examined leader emergence across 120 samples involving 32,579 people and leader effectiveness across 116 samples involving 42,487 people, in [a cross-cultural meta-analytic review of personality and leadership](https://experts.illinois.edu/en/publications/personality-and-leadership-meta-analytic-review-of-cross-cultural/). Big Five traits predicted leader effectiveness more strongly in collectivist societies than in individualistic ones, particularly extraversion and agreeableness, and honesty-humility predicted effectiveness beyond the Big Five.
The mechanism is what you should coach. Consideration, the relationship-oriented behavior, carried the effects of extraversion and agreeableness. Initiating structure, the task-oriented behavior, carried the effects of conscientiousness, extraversion and openness. So translate traits into those observable behaviors instead of telling a leader to be more agreeable in the abstract.
That translation gives you something to practice and re-measure. It also keeps you from treating a local leadership expectation as a universal law.
End every decision with two commitments. If a high-confidence risk flag exists, name the support plan before the promotion takes effect. If a development plan exists, give it a re-measurement date. A plan without a date is a hope, and hopes are hard to audit later.
Three Hypothetical Cases Showing the Reasoning Pattern
The following are constructed examples, not reported company outcomes. Each shows how a leadership assessment report can shape a decision and define what evidence to check afterward. The [Blanchard 2025 L&D Trends Report from the Center for Creative Leadership](https://www.blanchard.com/about-us/pressroom/2025-l-d-trends-report) reports anticipated increases in leadership-development spending and overall training budgets. Those figures describe budget expectations, not the results of the scenarios below. For an HR leader, the practical question is whether development spending leads to observable change.

Hypothetical Case One: A Sales VP's Conflict Flag
Signal: A hypothetical sales VP has strong revenue results, while the report identifies a high-confidence conflict risk supported by peer and direct-report feedback. Decision: The organization pauses consideration for a COO role and offers conflict-management coaching. Outcome measure: It checks the behavior and stakeholder ratings again before reconsidering the move.
The report does not establish that the VP would fail as COO. It identifies a risk worth testing before the role expands the consequences of the same behavior.
Hypothetical Case Two: A Plant Manager's Feedback Gap
Signal: In this constructed example, a plant manager rates their openness highly, but direct reports rate openness to feedback low. Turnover is also rising, though that trend alone cannot show why employees are leaving. Decision: The development plan focuses on inviting dissent in team meetings and responding to suggestions so employees know what happened to their input. Outcome measure: A short pulse survey checks whether staff experience those behaviors more often, while turnover is tracked separately.
The survey acts like a thermometer: it can register employees' experience of feedback, but it cannot explain every cause of turnover or prove that the manager's behavior caused it.
Hypothetical Case Three: A Product Head's Execution Gap
Signal: A constructed report for an externally hired product head shows strong strategic thinking and weaker execution. Decision: The organization pairs the leader with an operations lead and sets 90-day delivery milestones. Outcome measure: At 90 days, it reviews milestone progress and reassesses the execution competency before ending the support arrangement.
Across these examples, the report informs the decision rather than making it. The useful pattern is to connect a specific finding to a proportionate action, then define evidence that can show whether the action helped.
Confirm the Report Before You Act
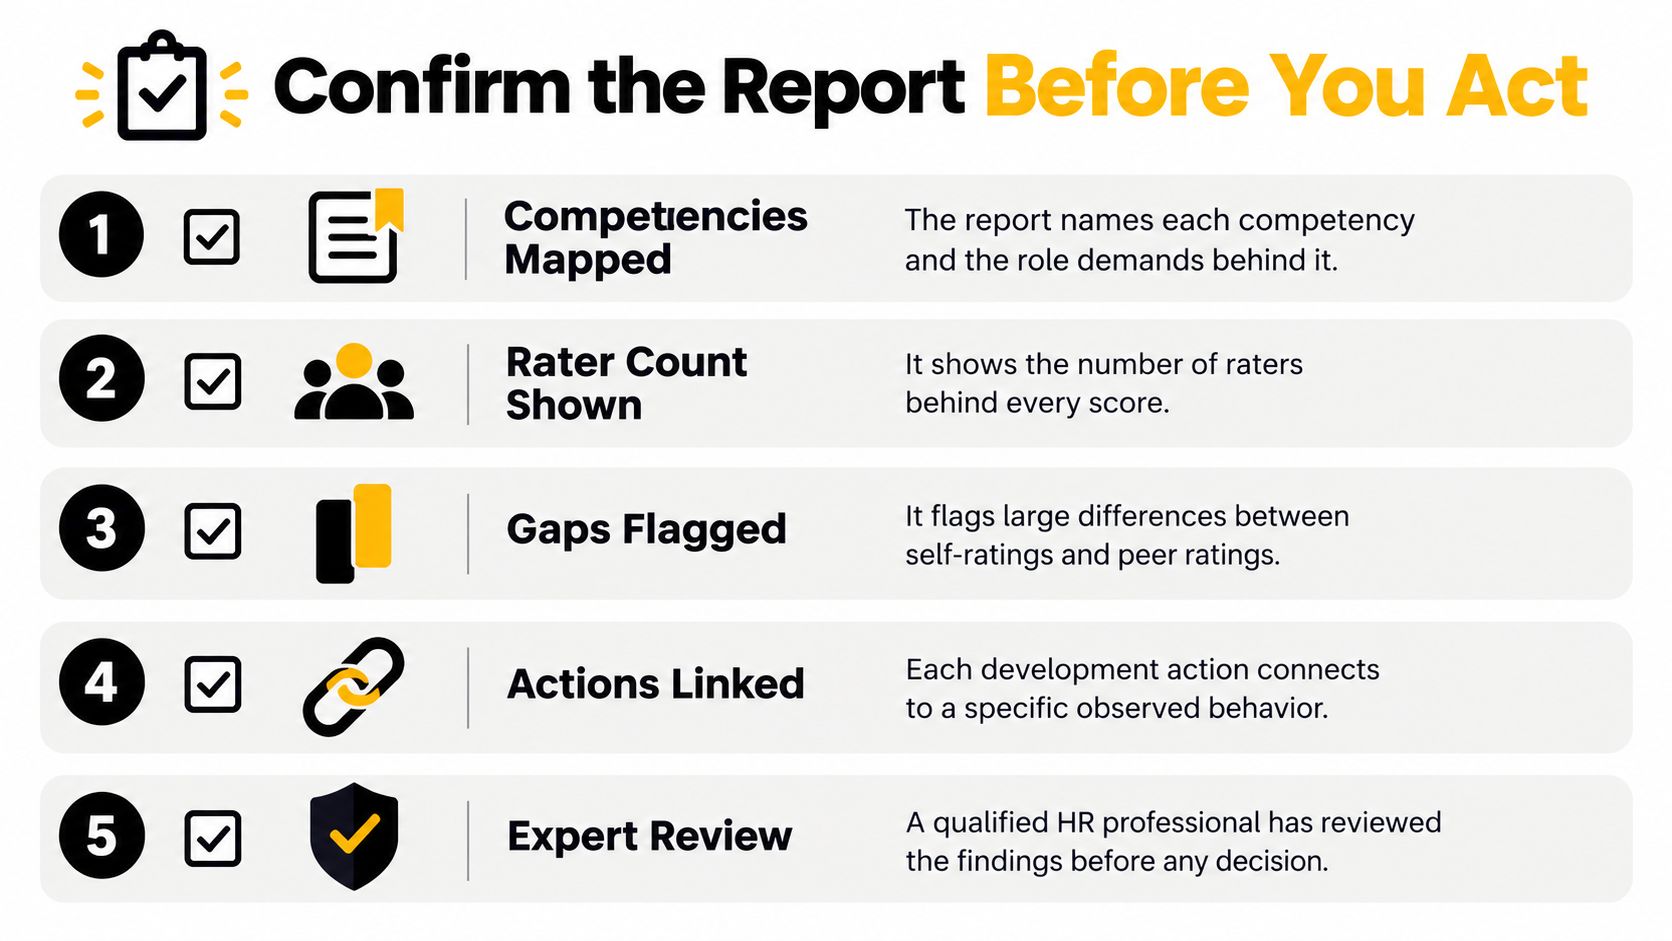
A polished report can still support a poor decision. Before approving a promotion or development action, check whether its evidence is clear enough to use and whether its limits are visible.
A Six Point Check
1. Competencies and role demands named: Each competency should connect to a specific demand of the role. Without that link, a score is like a measurement without a clear object. 2. Rater counts and spread shown: Check how many people rated the leader in each source group and how widely their scores differ. An average can hide sharply different experiences. 3. Predictive and descriptive separated: The report should distinguish evidence intended to predict performance from descriptions of observed traits or behavior. Those are not interchangeable. 4. Self-report flagged: A conclusion based only on a leader's own answers needs to be identified as such. It is one viewpoint, not independent confirmation. 5. Confidence and gaps stated: For each risk flag, look for the confidence level and any missing evidence. A cautious finding is more useful than false precision. 6. AI scoring explained: If AI supports scoring, the report should explain the constructs, data and scoring logic, and name the human reviewer accountable for the decision.
For AI-supported decisions, an explanation helps people understand how a conclusion was reached. The [LinkedIn Workplace Learning Report 2025 for Australia and New Zealand](https://business.linkedin.com/content/dam/lem/business/en-au/hire/resources/workplace-learning-report-2025-anz.pdf) is not evidence for a controlled experiment on perceived fairness, so do not use it to support a claim about that kind of experiment. Instead, ask the provider to show how the assessment works and what a score can and cannot establish.
To assess whether the underlying measures deserve confidence, review the basics of [assessment validity and reliability in talent decisions](https://synopsix.ai/blog/assessment-validity-and-reliability). Validity asks whether an assessment measures what it claims to measure. Reliability asks whether the results are consistent enough to inform a decision.
Set the Re-measurement Schedule Now
Treat a one-time report as a baseline, not proof that behavior has changed. Set follow-up dates and use the same indicators each time. Revisit self-ratings alongside direct-report observations, rather than averaging away differences between them. Then ask what evidence would demonstrate a change that matters to the role or the business.
Continuous feedback can help make behavior change observable over time. The [Oxford Academic chapter on continuous feedback and leadership behavior change](https://academic.oup.com/book/60717/chapter-abstract/527711927?redirectedFrom=fulltext) discusses that subject, but the specific leader and response counts sometimes attached to it are not established here. The practical point is to agree on what will be measured and when, so development does not end with the debrief.
Ask any assessment provider, Synopsix included, to disclose its constructs, data, scoring logic, uncertainty and human review process. Then apply the checklist to one report and put its first re-measurement date in the calendar before closing the file.
If you want to use a leadership assessment report as a baseline you can revisit, rather than a score you must defend, [Synopsix](https://synopsix.ai) offers behavioral assessments and leadership intelligence reports that connect competency findings, risk indicators and development actions in business language. Review how its assessment-to-action workflow might support a promotion or succession decision, using the checklist above to examine the evidence.