Organizational Network Analysis: A 2026 Guide
By Synopsix · September 6, 2026 · 19 min read
Only 3–5% of employees can account for 20–35% of value-adding collaboration in a typical organizational network, according to Rob Cross's work across more than 300 organizations ([Rob Cross on organizational network analysis](https://www.robcross.org/what-is-organizational-network-analysis/)). That finding changes the question HR leaders should ask. The issue isn't only who reports to whom. It's who people rely on, who connects separate groups, where expertise gets trapped, and which employees carry more coordination load than their job titles suggest.
Organizational network analysis, or ONA, makes those relationships visible. Used carefully, it helps CHROs sharpen hiring, onboarding, leadership development, succession, inclusion, and change decisions. Used carelessly, it produces attractive maps, privacy concerns, and confident recommendations built on weak data.
This guide takes the practitioner view. Network data is a starting question, not a verdict. The useful work begins after the visualization, when leaders test what the network suggests against employee experience, business context, and a specific people decision.
Why Organizational Network Analysis Matters Now
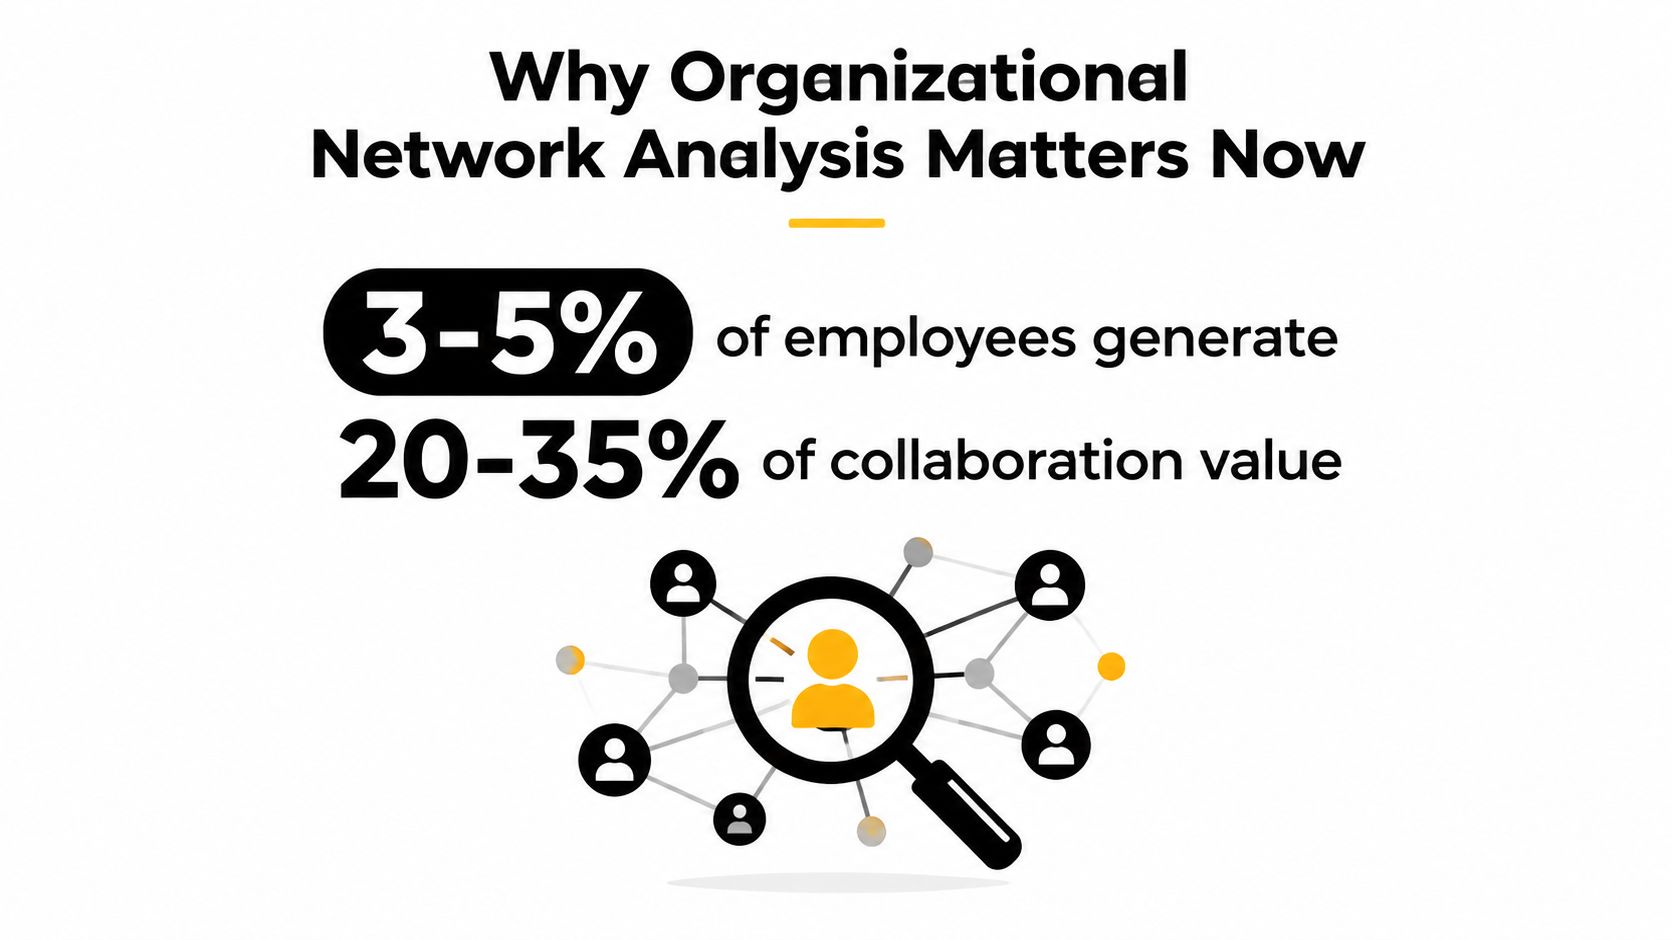
The 3–5% minority matters because formal structures hide disproportionate influence. A reporting line shows authority, not who supplies context before a decision, translates technical language for commercial teams, or gets called when a project stalls. ONA maps relationships involving people, tasks, knowledge, and resources, giving HR a fuller view of how work gets done than the org chart alone (Academy of Management Review).
Hybrid work, project teams, matrix structures, and rotating assignments have widened that gap. Employees can collaborate across departments without sharing a manager, while a formally connected team may rarely exchange useful knowledge. HR leaders who base hiring, development, or succession only on hierarchy can miss the relationships that keep execution moving.
Start with a business question
A practical ONA project starts with a decision, not a request to “map the network.” Ask whether cross-functional decisions are stalling, whether onboarding connects new hires with working experts, or whether a departure would expose a knowledge gap. The answer determines which ties to measure, which metrics to apply, and whether the proposed data collection respects employee expectations.
Use the map as evidence for investigation. A highly central employee may be a valuable broker, an overloaded coordinator, or someone who appears central because the dataset captures routine meetings. Interviews, workflow records, and manager context help distinguish those possibilities.
> Practical rule: Never turn a network position into a performance label without checking what flows through the relationship.
Formal authority explains only part of how work gets done. One industry summary estimates that roughly 20–30% of work moves through formal hierarchy, while 70–80% moves through informal networks of influence and trust. The balance varies by organization. The people decision remains consistent: leaders need the official design and the lived network, then must connect both to the employee context captured by their people-intelligence platform.
The Core Concepts Behind How Work Flows
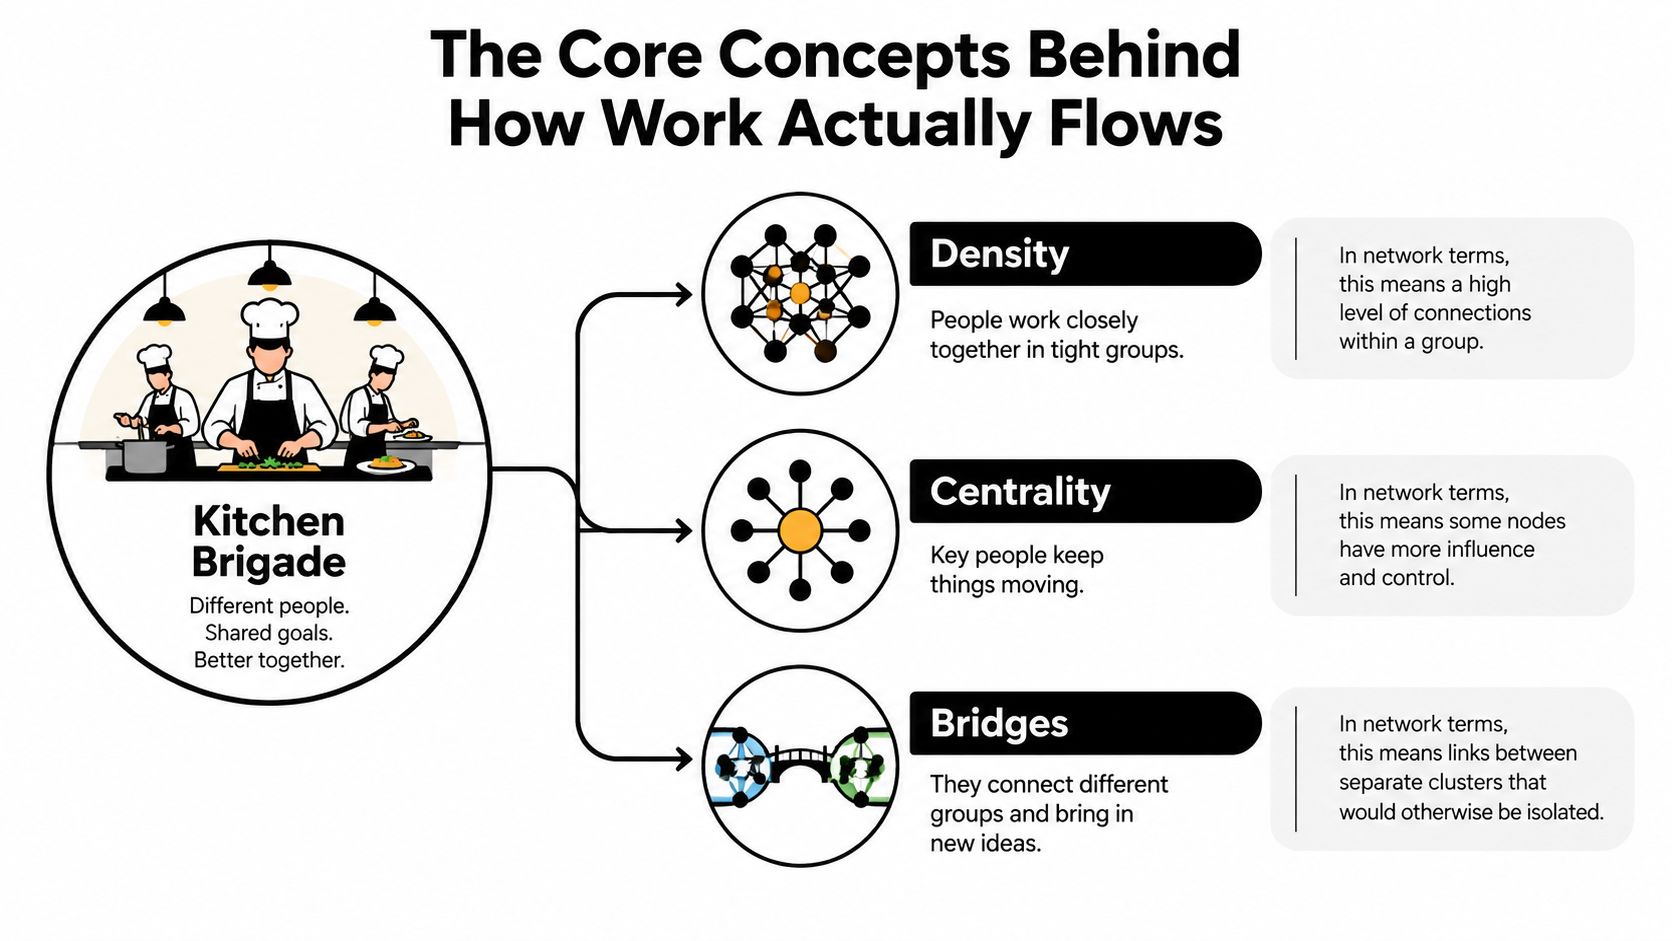
A kitchen brigade shows why the org chart cannot explain every workflow. The chef may formally lead the kitchen, yet service depends on how stations exchange information. If every station communicates with every other station, the kitchen has high density, meaning many possible connections are active. If orders pass through one expediter, that person has high centrality. If pastry and hot-food stations rarely interact except through one employee, that employee is a bridge.
Network density measures the proportion of observed ties among all possible ties. It describes communication intensity, not organizational health by itself. A study of organizational knowledge networks reported density of 0.032 for tacit knowledge and 0.019 for codified knowledge, showing why analysts should separate network types rather than combine every interaction into one enterprise score ([Journal of Management Studies](https://onlinelibrary.wiley.com/doi/10.1111/joms.13076)).
Centrality and brokerage
Centrality asks who occupies an important position in a flow. Degree centrality counts direct connections. In a small-town post office, it resembles the person everyone approaches with requests. HR might use this view to locate practical guides, subject-matter contacts, or employees who connect new hires to working expertise. The trade-off is clear: a high connection count may reflect useful access, routine administration, or low-value traffic.
Betweenness centrality asks who sits on routes between otherwise separate groups. An employee may connect engineering and sales, or operations and finance, without managing either function. That position can support coordination, but it can also expose a succession risk if knowledge and decisions depend on one person.
A broker spans a structural hole, the gap between groups with limited connection. Brokerage creates value when the person translates knowledge and coordinates action. It creates fragility when the organization has no alternative route. A broker is not automatically a leader or a risk. Analysts need the relationship type, workload, and business context before turning the position into a people decision.
Networks describe behavior, not status
Graph-based social network research established the foundations for ONA through probability models developed in 1959–1960, the launch of Social Networks in 1978, and organizational applications in 1979. The method has evolved, but the distinction remains: hierarchy describes formal position, while network structure describes interaction.
The most influential person in a network may not be the most senior. Identify whether a tie represents advice, information, trust, approval, or friendship. A map without that distinction can look precise while answering the wrong question, especially when a people-intelligence platform combines survey responses with collaboration records.
Employees also need a clear purpose and credible safeguards. Guidance on [change management for platform teams](https://ryware.dev/blog/change-management-processes) can help teams explain the rollout and show how findings will be used. [Organizational design principles](https://synopsix.ai/blog/what-is-organizational-design) help leaders judge whether a missing connection signals a design problem or an intentional boundary.
The following video introduces the mechanics behind organizational network analysis.
<iframe width="100%" style="aspect-ratio: 16 / 9;" src="https://www.youtube.com/embed/tTNas-B0a0Y" frameborder="0" allow="autoplay; encrypted-media" allowfullscreen></iframe>
Key Network Metrics Every HR Leader Should Understand
A metric earns its place when it changes a people decision. A high score alone does not justify hiring, promotion, succession, or team redesign.
Degree centrality identifies people with many direct connections. HR can use it to find practical onboarding guides, accessible subject-matter experts, or employees who help colleagues reach needed knowledge. The trade-off is clear: connection volume is not the same as influence. Someone may exchange many routine messages, while another supports fewer but more consequential decisions. Validate the result with interviews or work context before assigning a formal role.
Betweenness centrality highlights bridges between groups. It can focus a succession review on work that depends heavily on one person, especially across functions. A high score is not a promotion recommendation. Some brokers route administrative requests; others translate knowledge and resolve ambiguity. The intervention differs: document the first person's process, while protecting and scaling the second person's expertise.
Closeness centrality estimates how quickly an employee can reach others through the observed network. That makes it useful for planning change communications and locating people who can distribute information efficiently. It becomes unreliable when the data covers one channel only, or when fast access is mistaken for trust. Pair the score with tie type and employee feedback before choosing messengers.
Eigenvector centrality, including PageRank-style approaches, gives more weight to connections with influential people. It can surface informal leaders who have little visibility on the organization chart. HR still needs to identify what the ties represent. Advice, information, friendship, and routine approval produce different decisions, even when their network positions look similar.
Read the network at group level
The clustering coefficient helps assess whether a person's neighbors also connect with one another. A highly cohesive neighborhood may support coordination, or it may expose a closed clique that limits access to outside expertise. Community detection can reveal recurring groups that cross formal departments. Use those findings to test organizational design assumptions, then speak with people inside the groups before changing reporting lines or team boundaries.
Network density is most useful as a comparison across networks with the same scope, question, and data coverage. Advice, knowledge, and leadership networks can show different patterns in the same organization. Treating density as a target creates a vanity KPI. Higher connectivity may support coordination in one workflow and produce duplicated effort or meeting overload in another. Match any intervention to the work, the tie type, and the cost of adding more connections.
| Metric | People decision it can inform | Practical intervention | Decision risk | |---|---|---|---| | Degree centrality | Onboarding and expertise access | Invite high-connection employees to guide new hires, then check workload | Treating volume as value | | Betweenness centrality | Succession and dependency review | Document critical processes and build alternate cross-functional links | Promoting brokers automatically | | Closeness centrality | Change communication planning | Select reachable messengers and test whether employees trust them | Assuming reach equals trust | | Eigenvector or PageRank-style influence | Informal leadership detection | Ask influential employees to advise on adoption, without labeling them leaders | Ignoring tie content | | Clustering coefficient | Team integration and clique review | Connect a closed group with relevant outside experts | Calling every cohesive cluster healthy | | Network density | Collaboration diagnosis | Remove redundant coordination or strengthen sparse links where work requires it | Using density as a universal goal | | Community detection | Organizational design and silo review | Compare network groups with formal teams and investigate the gaps | Treating algorithmic clusters as teams |
These measures expose brokers, structural holes, and closure effects that formal charts miss. Sparse cross-functional links may also indicate slower decisions or dependence on central actors, as discussed in research on organizational network analysis and network structure. The metric does not choose the intervention. It narrows the question HR should investigate, and a people-intelligence platform should keep the underlying context visible rather than reducing employees to rankings.
Data Sources and How to Collect Network Data Ethically
Most ONA programs combine three sources, each with a different trade-off.
Focused surveys ask questions such as, “Who do you go to for expertise in this workflow?” They capture trust, advice, and knowledge that digital exhaust can't reliably infer. They also introduce recall bias, nonresponse bias, and survey fatigue. Keep the instrument focused on the business question, and don't ask employees to reconstruct every relationship.
Passive collaboration signals come from tools such as email, calendars, Slack, Teams, and Jira. They can provide fresher behavioral traces, but contact doesn't prove meaningful collaboration. Calendar density can reflect mandatory meetings, while message volume can reflect a support burden rather than influence.
HRIS-adjacent records include project assignments, reporting lines, role data, and team membership. These records provide essential context, but they describe formal participation more reliably than informal trust. A sound design usually joins sources carefully rather than treating any single source as complete.
| Data Source | Cost | Freshness | Bias Risk | Privacy Risk | |---|---|---|---|---| | Focused survey | Moderate | Periodic | Recall and response bias | Stated relationships can feel identifiable | | Collaboration tools | Moderate to high | Ongoing | Channel and tool coverage bias | Behavioral monitoring concerns | | HRIS and project records | Lower after setup | Depends on updates | Formal-structure bias | Sensitive employee attributes |
Build safeguards before collection
Publish a plain-language notice that states what data you'll collect, why you need it, who can see outputs, and how long you'll retain it. Give employees a meaningful opt-out where appropriate, and avoid reporting any individual node when fewer than 5 people are represented. Set a defined retention window instead of keeping raw interaction data indefinitely.
Create a review group before launch. It should include people analytics, HR or organizational development, legal or privacy counsel, information security, employee relations, and employee representatives where relevant. The group should approve the questions, source fields, aggregation rules, access permissions, and deletion process.
> Privacy is part of delivery. If employees discover the purpose and safeguards after collection begins, the project has already lost credibility.
Keep passive data at the narrowest level necessary. Don't ingest message content when metadata can answer the question, and don't expose individual rankings to managers who lack a legitimate need. Teams evaluating privacy-sensitive meeting and note-taking workflows may also find this overview of [European AI note takers for Mac](https://getweeve.io/blog/the-best-privacy-first-ai-note-takers-in-europe-in-2026) useful as a broader example of privacy-first product thinking.
For a practical foundation, connect ONA with the broader discipline of [people analytics in HR](https://synopsix.ai/blog/people-analytics-in-hr), where governance and interpretation should sit alongside technical analysis.
HR Use Cases From Hiring to Succession Planning
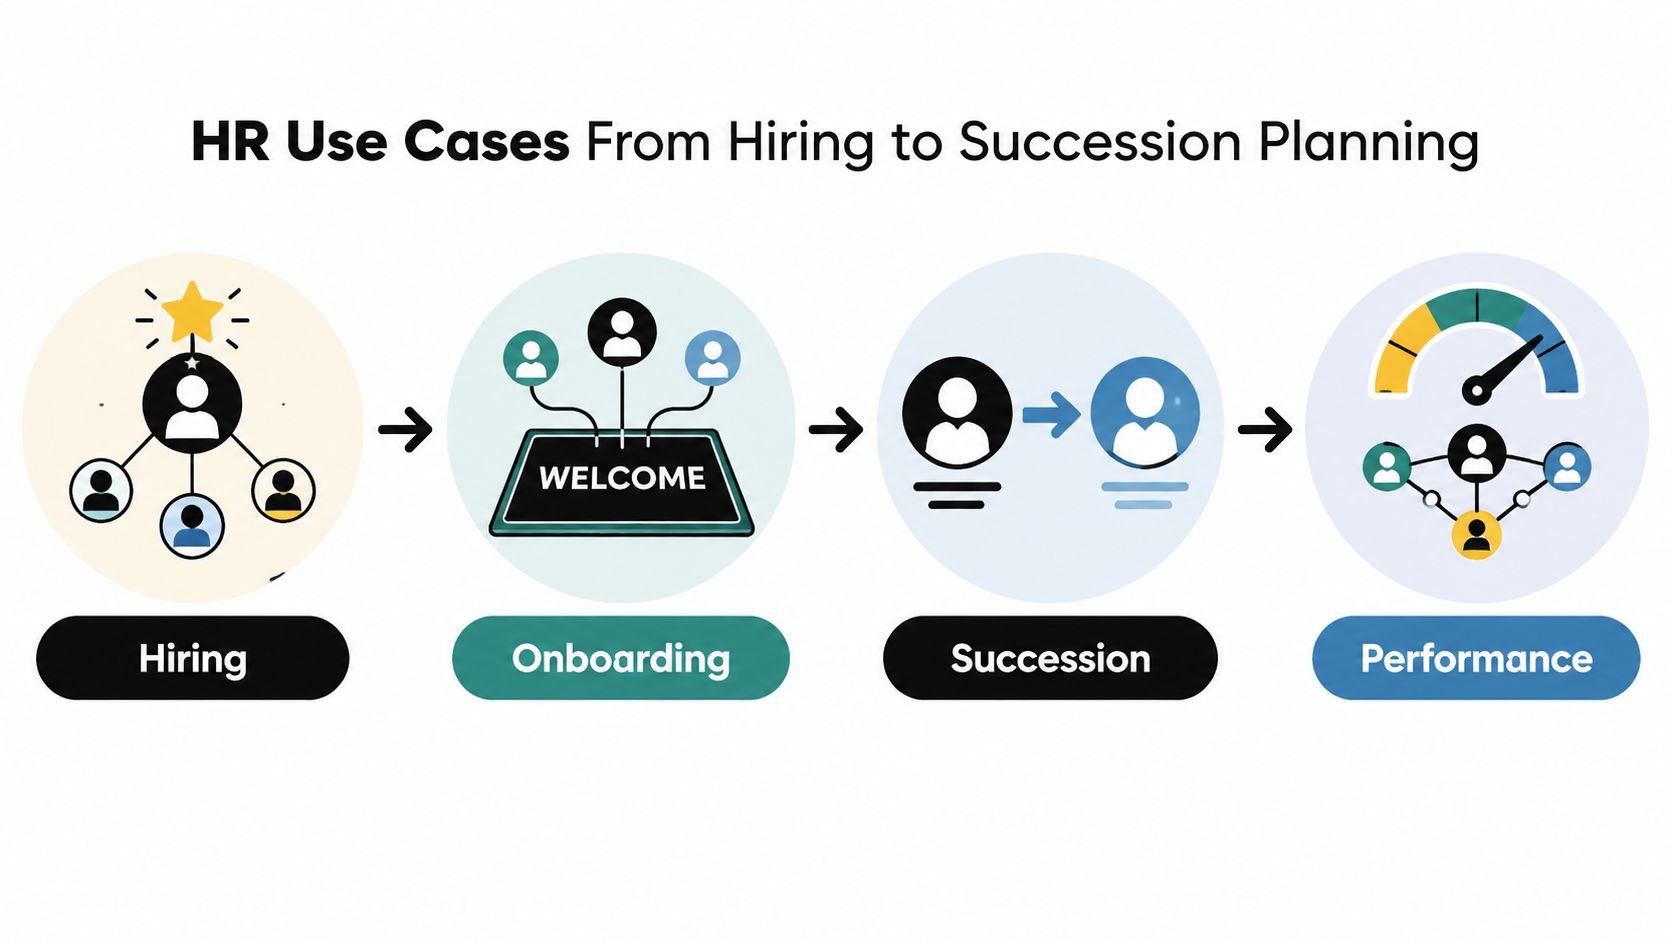
The same network can change several HR decisions, but the relevant signal shifts with the decision.
Hiring
A recruiting team might compare two finalists with similar technical credentials. One candidate has a history of building bridges across specialist communities, while the other is well-connected within one established group. If the role requires cross-functional integration, the structural-bridge signal may deserve more weight than referrals from long-tenured insiders.
That doesn't mean “hire the most connected person.” It means define the role's network demands before assessing fit. A bridge-heavy role needs translation and boundary spanning. A specialist role may benefit more from deep local expertise.
Onboarding
A new employee's formal buddy often knows the process, but not necessarily the people who solve unusual problems. Degree centrality and expertise ties can help sequence introductions to the actual problem-solvers, decision interpreters, and workflow owners.
The practical intervention is small. Replace a generic list of names with a purposeful connection plan, then check whether the new hire reaches the relevant communities rather than merely completing introductory meetings.
Leadership development
A manager may run a cohesive team that rarely connects beyond its boundary. Another manager may coach peers across functions and act as an informal translator. Clustering and betweenness can distinguish those patterns, but neither should be treated as a leadership score by itself.
Use the findings to tailor development. The siloed manager may need cross-functional operating habits. The informal coach may need support, recognition, and protection from invisible coordination overload.
Succession planning
Titles and nominated backups provide only one view of bench strength. A stronger question is who colleagues contact when a subject-matter expert goes on leave. Network position, expertise nominations, and alternative paths through the system can reveal whether knowledge is distributed or concentrated.
ONA has also been applied to behavioral prediction. One employee-retention study reports that eigenvector centrality, structural holes, and k-shell scores predict voluntary turnover ([Springer study on employee retention](https://link.springer.com/article/10.1007/s13278-023-01031-w)). That signal should prompt a conversation about role design, recognition, workload, and connection, not a presumption that someone will leave.
The same chart can justify opposite actions. High betweenness might support a succession investment, or it might trigger workload redistribution. The business question decides which interpretation is responsible.
Connecting ONA to People Intelligence Platforms
ONA becomes more useful when it supplies context to other people intelligence, rather than pretending to replace it. A network metric can show that someone bridges multiple groups. It can't explain whether that person enjoys the work, has the behavioral flexibility for a larger role, or is close to exhaustion.
A sensible integration pipeline has four stages:
1. Clean the network data. Remove duplicate identities, exclude irrelevant channels, define the observation period, and distinguish formal reporting from observed ties. 2. Join metrics to employee records. Add centrality, brokerage, clustering, or isolation measures to the appropriate employee or team profile, with access controls and aggregation rules. 3. Add behavioral context. Use assessments to examine working preferences and likely interaction patterns. Use simulations to test how a person or team may respond to ambiguity, conflict, or change, while treating network position as context rather than proof. 4. Surface team patterns. Dashboards can show load imbalance, invisible expertise, fragile dependencies, or missing bridges for leaders who need an intervention view rather than a graph.
What platforms handle well
Technology helps people analytics teams detect patterns across large, changing datasets and compare network signals over time. A 2025 review of AI and ONA in project management describes growing interest in combining the methods to identify knowledge flow, key individuals, and collaboration patterns, while also highlighting gaps in intervention design, causal impact, and implementation ([AI and ONA in project management](https://epmj.org/journals/2025-v15-i1-01/)).
That limitation matters. A platform can identify a central connector, but a manager still needs to ask what work reaches that person, whether the load is sustainable, and what alternative routes should be developed. It can model a possible team configuration, but it can't create trust through a dashboard.
When comparing vendors, review the broader category with a grounded [people analytics software comparison](https://www.myculture.ai/blog/best-hr-analytics-software-for-people-teams). Look for data lineage, explainable metrics, role-based access, aggregation controls, retention settings, and intervention tracking, not only animated network visuals.
For teams combining assessments, simulations, and network views, a [talent intelligence platform](https://synopsix.ai/blog/talent-intelligence-platform) should be treated as a decision-support layer. ONA is one input, not the verdict.
Measuring ROI and Avoiding Common Pitfalls
ONA ROI starts before the first survey or integration. Capture a baseline tied to the decision, such as cross-team project cycle time, onboarding ramp duration, regrettable attrition, internal mobility, or engagement. Without a baseline, a post-launch map can show movement without demonstrating that the intervention improved anything important.
Then define leading network indicators. Depending on the use case, those may include broker coverage, informal leadership access, isolation, alternative paths to expertise, or concentration of coordination demand. Track the measure alongside the intervention, not as a substitute for the outcome.
A change campaign might aim to reduce dependence on a few bridges. An onboarding program might aim to connect new hires to expertise communities. A succession intervention might aim to expand the number of people able to carry critical knowledge. Each requires a different network measure and a different business result.
The failures vendors skip
Survey fatigue appears when ONA repeats questions employees have already answered in engagement, pulse, inclusion, or 360 surveys. Combine instruments where possible, remove questions that don't affect a decision, and explain what changed because of earlier participation.
Privacy exposure grows when consent notices are vague or when managers can infer individual identities from small groups. Clear purpose, minimization, aggregation, retention limits, and access controls are operational requirements, not legal decoration.
Density traps make highly connected teams look universally healthy. Dense ties may support coordination, but they can also reinforce redundancy, reduce outside input, or increase meeting load. The relevant question is whether the network fits the work.
Map worship happens when leaders treat a visualization as the answer. ONA can show that a team is isolated, but it can't establish whether the cause is poor leadership, deliberate specialization, incompatible tools, or a temporary project phase.
Evidence on inclusion illustrates the caution. A 2025 scoping review found only 15 studies meeting its criteria and concluded that the evidence remains small and fragmented, even though ONA can reveal barriers to inclusion and belonging ([2025 scoping review of ONA and inclusion](https://www.frontiersin.org/journals/psychology/articles/10.3389/fpsyg.2025.1708522/full)). Use the map to investigate access, voice, and opportunity. Don't claim that a network score proves belonging.
ONA also can't directly measure relationship quality, intent, motivation, or the meaning employees attach to a connection. Qualitative interviews remain essential.
Implementation Checklist and Your First 90 Days
A first ONA pilot should be narrow enough to govern and meaningful enough to influence a real decision. Select one population of 200–500 people, define the business question, and agree in advance what action the organization will take if the findings are uncomfortable.
Days 1–30
Secure an executive sponsor who can remove barriers without demanding individual rankings. Document the decision, network type, data sources, privacy notice, opt-out process, aggregation threshold, retention window, and access list.
Use a governance working group to review the collection plan. Map the available HRIS, project, calendar, email, Slack, Teams, or Jira data, then exclude fields that don't answer the question. Prepare a communication plan that explains benefits and limits in ordinary language.
Days 31–60
Collect the minimum data required. Clean identity records, validate reporting lines, check missingness, and test whether the observed network reflects the work under review. Share an initial read with pilot leaders and selected employee representatives before wider HR distribution.
Ask what the map gets wrong. A missing tie may reflect an untracked tool, a relationship outside the selected period, or a deliberate boundary. Validation prevents technical confidence from becoming organizational misinformation.
Days 61–90
Choose one or two interventions, such as targeted onboarding introductions, broker development, workload redistribution, or succession-pool expansion. Assign an owner, define leading indicators, record the starting point, and schedule re-measurement.
Use this compact checklist before launch:
A 2022 event-forecasting study shows the potential of longitudinal network features, reporting 87% prediction accuracy for a decision-tree classifier on its sample ([organizational network event forecasting study](https://onlinelibrary.wiley.com/doi/10.1155/2022/3079936)). That result supports experimentation, not blind adoption. Your first ninety days should prove that the organization can collect responsibly, interpret accurately, and act on what it learns.
---
Synopsix helps HR teams connect behavioral assessments, predictive simulations, and team complementarity views to practical hiring, development, and workforce decisions. Visit [Synopsix](https://synopsix.ai) to see how people intelligence can add behavioral context to organizational network analysis without treating any single signal as the final answer.