Psychometric Data Analysis for Smarter People Decisions
By Synopsix · August 19, 2026 · 19 min read
A finalist for a regional operations role receives a leadership potential score of 92, the cleanest number on the slate. Three candidates rank lower, so the hiring panel chooses the top scorer. Nine months later, the new leader struggles with stakeholder management and team motivation, while the team records its worst engagement result of the year.
The assessment report looked defensible. Reliability was high, a percentile band appeared beside the score, and the adverse impact ratio had already cleared review. Yet the decision failed. The problem wasn't the arithmetic. The index had been interpreted as job-specific predictive potential when it represented a narrower set of measured characteristics.
That distinction sits at the center of psychometric data analysis. A precise score can summarize responses consistently while still producing a weak business signal. HR leaders need a disciplined way to understand what a score supports, what it doesn't support, and how it should influence hiring, promotion, team design, and development.
When a Clean Score Derails a Good Decision
The hiring panel treated the leadership index as a verdict. It should have treated it as evidence requiring context. A high score may indicate a pattern of responses associated with certain traits or behaviors, but it doesn't automatically establish that a person will lead effectively in a particular operating environment.
The regional operations role demanded more than leadership drive. It required conflict navigation across stakeholders, sustained coaching, operational discipline, and the ability to motivate a team through competing priorities. The index may have captured elements related to leadership potential, but the panel never tested whether those elements translated into the behaviors the role required.
> Practical rule: A score becomes useful only when the organization can explain which job behavior it represents, under what conditions, and with what evidence.
The panel also overlooked response interpretation. A candidate can present a polished profile for many reasons, including genuine self-confidence, strategic self-presentation, or [impression management](https://synopsix.ai/blog/define-impression-management). None of those possibilities can be resolved by looking at the headline score alone.
The failure wasn't that the organization used psychometrics. The failure was that it compressed a multidimensional decision into one ranking. A responsible interpretation would have combined the assessment with structured interview evidence, a work sample or simulation, role-specific requirements, and a review of possible risks.
That approach changes the question from “Who has the highest score?” to “What does this score add to our understanding of this person's likely behavior in this job?” It also gives the hiring manager a clear boundary. The assessment can inform a decision, but it shouldn't replace judgment about role demands, evidence quality, and context.
What Psychometric Data Analysis Actually Is
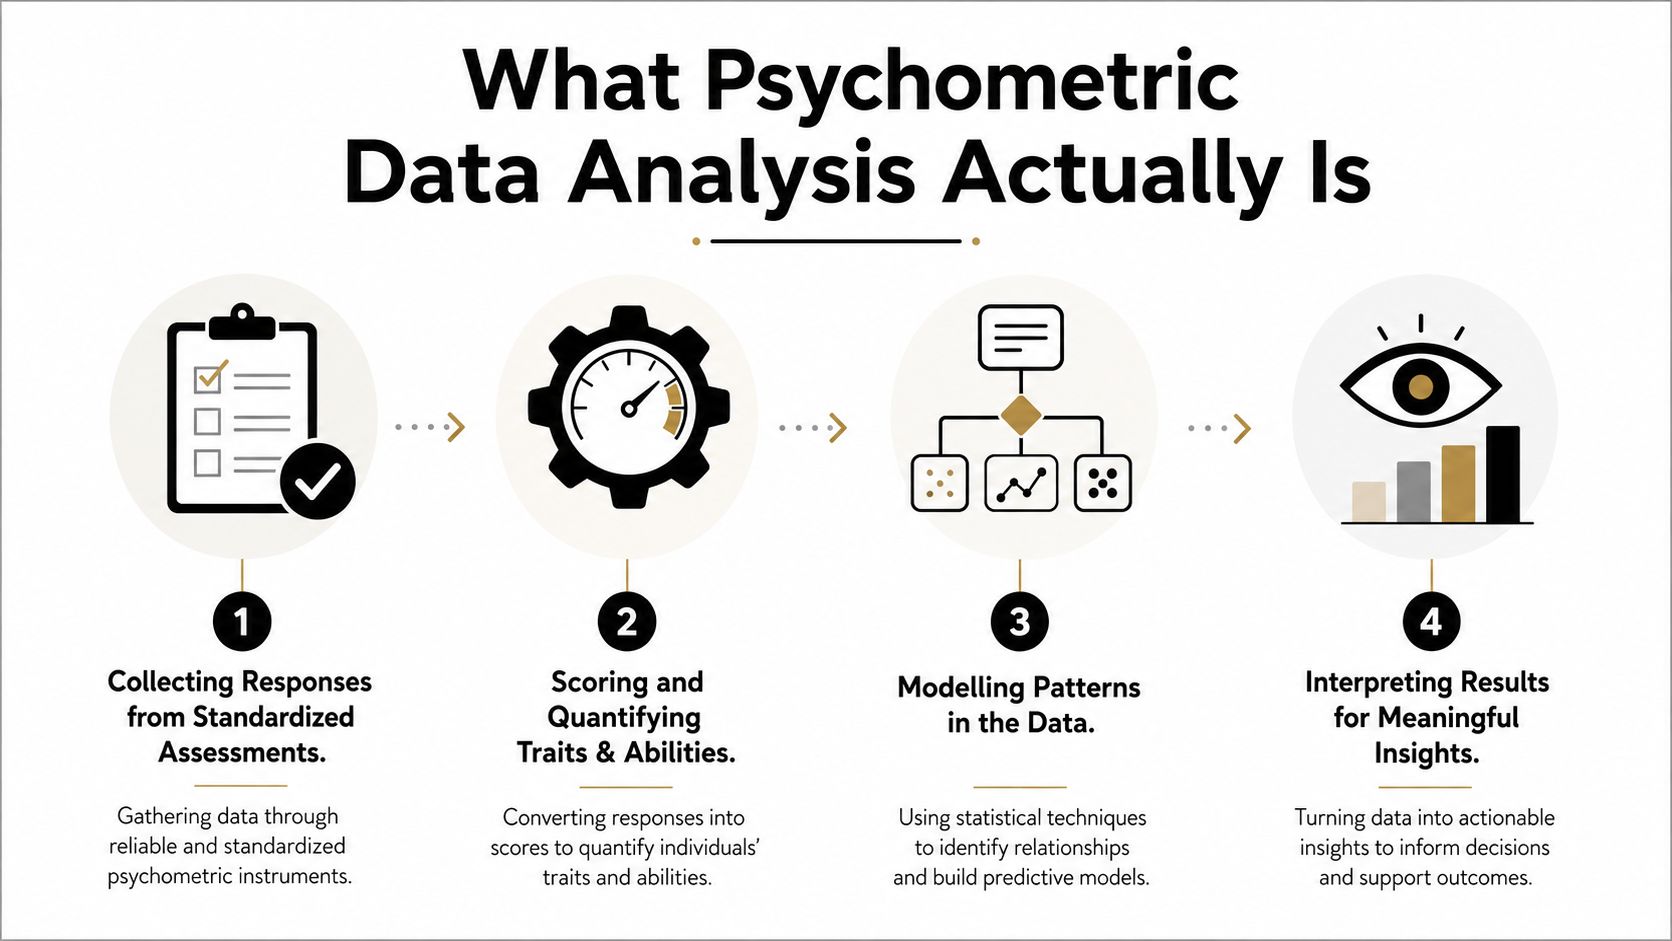
Psychometric data analysis is the disciplined process of collecting, scoring, modelling, and interpreting responses from standardized assessments of traits, abilities, and behavioral styles. The objective isn't merely to produce a number. It's to support a defensible inference about how a person may think, respond, or behave in a defined setting.
The field's roots reach back to the late nineteenth century. Francis Galton established the Anthropometric Laboratory to measure psychological attributes experimentally, including keenness of sight, color sense, and judgment of eye. This period is commonly treated as the modern birth of psychometric work, as documented in the [historical overview of psychometric theory and validity](https://uk.sagepub.com/sites/default/files/upm-assets/125019_book_item_125019.pdf).
By 1927, psychometric theory had formalized two central properties of measurement instruments. Reliability addressed score consistency, while validity addressed whether a test measured what it claimed to measure. The American Psychological Association's 1954 testing standards later introduced four explicit validity categories, content, concurrent, predictive, and construct validity, which became foundational to modern assessment analysis.
The boundary with HR analytics
Generic HR analytics works with operational data such as turnover, absence, promotion, compensation, and engagement. It can describe what happened across a workforce. Psychometric analysis asks a different set of questions: What construct does this assessment measure? How consistently does it measure it? Do the scores support the intended interpretation?
The scope typically includes:
Engagement survey mining and compensation modelling may be valuable forms of people analytics, but they aren't psychometric analysis just because they involve statistics. A practical introduction to the assessment boundary appears in [what psychometric testing means for organizations](https://synopsix.ai/blog/what-is-psychometric-testing).
The distinction matters because a dashboard can show correlations without establishing measurement quality. Psychometric analysis examines the chain from response to score to construct to decision. Break that chain, and the final recommendation may look scientific while resting on an unsupported interpretation.
The Analytic Pipeline from Raw Responses to Insight
Consider a cognitive ability and personality battery administered to 480 operations candidates. The assessment team shouldn't begin by ranking candidates. It should begin by asking whether the data are usable and whether the planned score can support the decision.
Start with response quality
Data cleaning comes first. Analysts review response time outliers, straight-lining, missingness patterns, duplicate records, and identity checks through keystroke or biometric signals where available. These checks don't prove that a candidate lacks a trait. They identify response conditions that may make the score less interpretable.
Missingness deserves particular attention. If candidates skip the same type of item, or if missing responses cluster around a sensitive construct, the pattern may reflect accessibility, language, fatigue, or deliberate avoidance. Deleting those records without understanding the pattern can alter the population being measured.
Choose a scoring model
A raw sum treats every item as though it contributes in the same way. An item response theory approach instead estimates a latent trait position, often represented as a theta score, by comparing response patterns with item characteristics. That can place candidates on a common scale and provide more information about how items perform across trait levels.
Rasch-style model fit is especially useful here. Analysts compare observed responses with expected values from the latent-trait model. Systematic misfit signals weak measurement properties and can guide item revision or removal, as explained in this [psychometrics methods appendix on item response theory and Rasch analysis](https://researchonline.lshtm.ac.uk/id/eprint/4664614/11/Appendix_5_Psychometrics_methods_details.pdf).
Test the instrument's structure
The personality battery might begin with 30 facets, but exploratory and confirmatory factor analysis could show that the responses support five more strong dimensions. That result doesn't automatically validate the five-factor interpretation. Analysts still need to examine whether the factor structure is stable, whether items load as expected, and whether the structure works across relevant groups.
A defensible pipeline then estimates reliability through Cronbach's alpha, omega, and test-retest evidence. Reliability isn't a single universal property of a scale. The Person Separation Index, for example, evaluates how well a measure distinguishes respondents at different trait levels, with values above 0.70 commonly interpreted as adequate for operational use in the cited methods guidance.
Link scores to outcomes
The assessment team can examine correlations between cognitive and personality scores, structured interview ratings, and six-month performance scores. But correlation isn't the same as a validated selection rule. Analysts must define the criterion, account for missing outcome data, and ask whether the operational performance measure is itself dependable.
Predictive modelling can add another layer. A cross-validated logistic regression may estimate the probability of a defined outcome, but the model should be evaluated on holdout data before anyone uses it for selection. Without a holdout sample, the model may appear accurate because it has adapted too closely to the data used to build it.
The final deliverable shouldn't be a ranking alone. It should document data quality, scoring assumptions, reliability, factor structure, validity evidence, model performance, uncertainty, and the exact decision the evidence can support. Guidance on translating scores into decisions is available in [assessment interpretation for HR teams](https://synopsix.ai/blog/assessment-interpretation).
Reliability and Validity in Practice
Reliability asks whether scores are sufficiently consistent for their intended use. Validity asks whether the interpretation attached to those scores is supported. HR teams often confuse the two because a reliable score feels trustworthy, but a measure can produce stable results while consistently measuring the wrong construct.
For a high-stakes selection program, I recommend setting a stronger internal consistency expectation around 0.80. For development use, 0.70 is a reasonable practical threshold. Test-retest stability should exceed 0.70 across a reasonable interval when the underlying trait is expected to remain stable. These are decision standards, not universal laws, and they must be read alongside construct coverage, subgroup performance, and intended use.
The [Orange Neurosciences reliability guide](https://www.orangeneurosciences.ca/guide/reliability-test-retest) is a useful primer for teams that need to distinguish internal consistency from stability over time.
Read validity as an evidence chain
A hiring assessment should show more than one favorable coefficient. Start with content evidence. Subject-matter experts should be able to connect the items and constructs to actual job requirements, not a vague idea of organizational culture.
Next, review criterion-related evidence. Does the score relate to structured interview ratings, operational performance, quality, tenure, or another outcome that matters for the role? Then check convergent evidence against adjacent constructs. A measure of analytical reasoning should relate sensibly to other indicators of reasoning, while remaining distinguishable from unrelated traits.
The modern interpretation is important. In 1971, Cronbach argued that it is the interpretation of test scores, rather than the test itself, that is validated. Messick's 1989 work and Kane's 2013 interpretive-argument approach reinforced this shift toward evidence chains involving correlations, construct structure, and intended use. The [evolution of validity in modern psychometrics](https://iaea.info/documents/the-evolution-of-validity-and-modern-psychometrics-do-we-need-to-revisit-item-validity/) provides the historical context.
Examine cutoffs skeptically
A cutoff isn't justified because it looks neat on a dashboard. The organization must explain why that threshold relates to job performance, how many candidates it excludes, whether the score is precise enough near the boundary, and whether the same interpretation applies across groups and locations.
Red flags include:
A report isn't ready for consequential use when it hides adverse impact data, offers no local validation plan, or treats reliability as proof of predictive value.
Where Most Programs Stop Too Early
Most assessment programs treat the vendor's technical manual as the finish line. It should be the starting gate.
A strong manual can show that an instrument measures something consistently and that its scores have job-relevant relationships in particular samples. It doesn't tell you whether your hiring managers will interpret the scores correctly, whether candidates in your pipeline respond comparably, or whether the score improves decisions in your operating context.
That gap is epistemic as much as statistical. Recent psychometrics literature argues that methods can generate useful predictions without independently justifying strong claims about the underlying traits or phenomena being measured. The [discussion of the neglected link between test data and real-world constructs](https://pubmed.ncbi.nlm.nih.gov/40642039/) captures the risk clearly: a precise dashboard can still rest on a weak interpretation layer.
Treat local evidence as operating data
Require local replication of validity evidence on at least 200 hires before treating a score as a mature selection signal. That doesn't mean waiting for a perfect dataset before using an assessment. It means separating an initial pilot from an established decision rule and tracking the difference openly.
Monitor the program continuously:
A business signal has three characteristics. It maps to a behavior the organization can observe, it has evidence in the target context, and it changes an action that leaders can evaluate afterward. A numeric summary has none of those requirements.
> A clean report is necessary evidence. It isn't interpretation discipline.
How Psychometric Data Compares to Other Predictors
Psychometric data shouldn't be judged in isolation. Hiring teams compare it with unstructured interviews, reference checks, résumés, work samples, and other predictors, often without understanding how much measurement error each method introduces.
Classic meta-analytic evidence found structured interviews had a validity of .44, compared with .33 for unstructured interviews, as reported by [McDaniel and colleagues' interview validity meta-analysis](https://home.ubalt.edu/tmitch/645/articles/McDanieletal1994CriterionValidityInterviewsMeta.pdf). That finding supports a practical recommendation: if a company has limited assessment budget, it should structure interviews before adding more dashboard features.
The comparison is best treated as directional because validity depends on construct, criterion, role, administration, and implementation.
| Method | Predictive value | Fairness risk | Candidate experience | Cost per hire | |---|---|---|---|---| | Unstructured interview | Variable and vulnerable to interviewer judgment | Requires active monitoring | Familiar but inconsistent | Usually low direct cost | | Structured interview | Stronger evidence than unstructured interviewing | More standardized, still requires audit | Clearer and more comparable | Moderate preparation cost | | Personality or cognitive assessment | Depends on construct and role relevance | Requires subgroup analysis and validation | Can be consistent when explained well | Scalable after setup | | Reference check | Contextual, but dependent on source quality | Sensitive to access and relationship bias | Often familiar to candidates | Moderate coordination cost | | Résumé review | Useful for baseline experience screening | Can reproduce education and network inequities | Familiar, but often opaque | Low direct cost | | Work sample | Direct evidence of task performance | Must account for accessibility and prior opportunity | More effort for candidates | Higher administration cost |
A later synthesis using 125 coefficients and a total sample of 32,428 found that interview reliability is affected by random response, transient, and consistency errors, as summarized in the synthesis of interview reliability and adverse impact. The implication is simple. Low agreement in interviews isn't just an interviewer coaching issue. The structure of the method creates error.
Psychometric data adds the most value when it complements structured interviews and work samples. Used as a standalone screen, it can narrow a pool without explaining whether the selected candidates can perform the work. Used as one evidence stream in a designed process, it can reveal behavioral risks and strengths that interviews often miss.
Turning Scores into Business Signals HR Can Use
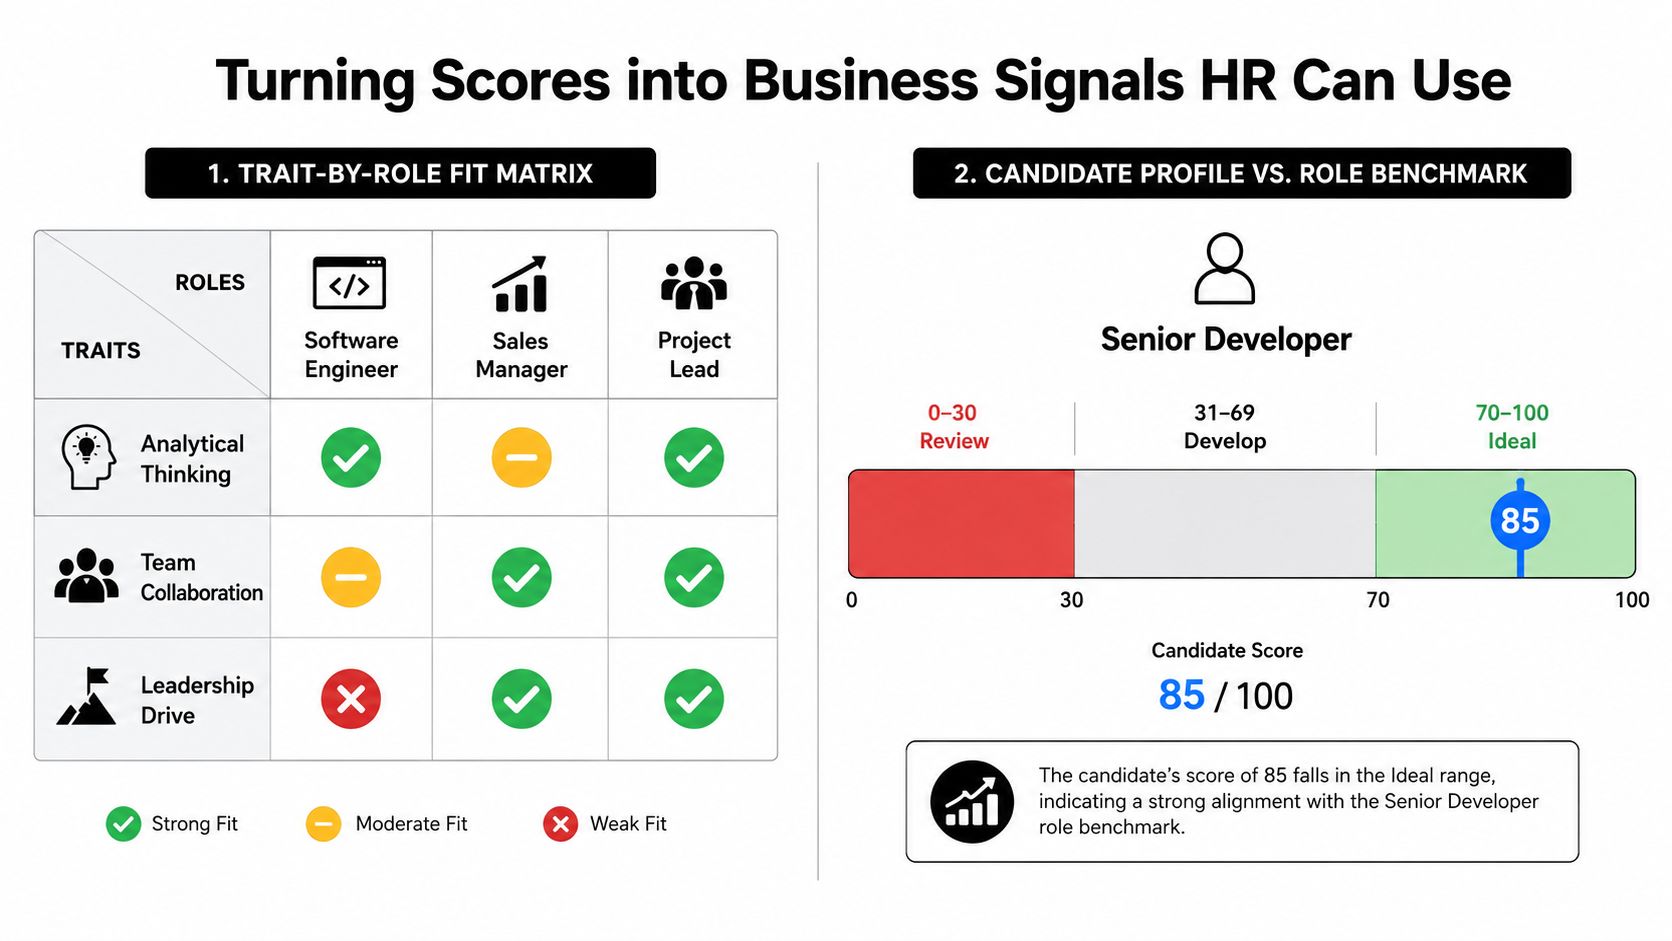
A raw distribution means little to a hiring manager. The interpretation layer must connect the score to a behavior, a role requirement, and a decision boundary.
Write the behavior before showing the score
Start with job analysis. If a role requires dependable follow-through, define what that looks like in practice, such as closing operational actions, maintaining handoffs, or escalating risks early. Then explain which assessment pattern may relate to those behaviors and what other evidence the interviewer should seek.
Avoid translating a trait directly into a judgment. A low Conscientiousness score isn't automatically a fit problem. It becomes more relevant when paired with high Reversal Tolerance and a role that demands sustained planning, sequencing, and procedural consistency. The interpretation should identify a question or simulation, not label the person.
Use different outputs for different audiences:
Percentile ranks shouldn't become false precision. A candidate at one percentile boundary isn't necessarily meaningfully different from someone near the neighboring boundary, especially when measurement error and confidence intervals are ignored.
Make the visualization serve the decision
A sales team profile built from aggregated scores can highlight a likely pipeline coverage gap before that weakness appears in quota reviews. The chart doesn't predict a result by itself. It prompts leaders to examine whether the team has enough prospecting persistence, relationship orientation, analytical planning, or coaching capacity for its commercial model.
For organizations designing a data workflow, the case study on [powering real time recruitment with Streamkap](https://streamkap.com/blog/case-study-inhire-powers-real-time-ai-recruitment-with-streamkap) offers useful context on connecting recruitment data flows to operational processes.
The visual should answer one question at a time. “Is this candidate suitable?” is too broad. “What behavior should the manager test?” is actionable. “Which capability is underrepresented in this team?” is actionable. “What development plan follows from this pattern?” is actionable.
<iframe width="100%" style="aspect-ratio: 16 / 9;" src="https://www.youtube.com/embed/Dt6sefbuMXs" frameborder="0" allow="autoplay; encrypted-media" allowfullscreen></iframe>
One option for this translation layer is Synopsix, which turns behavioral assessment responses into comparable profiles, role-oriented reports, simulations, compatibility analysis, and development guidance. The important standard isn't the platform name. It's whether the output preserves the distinction between measured evidence, interpretation, uncertainty, and action.
Fairness and Legal Considerations in Modern Hiring AI
A single global fairness score is not an adequate audit posture. Hiring systems make decisions at the position level, so fairness monitoring must examine position, job family, location, recruiter, and other meaningful slices.
A vendor may report a headline adverse impact ratio of 0.8 across the full hiring population. That aggregate can still hide a serious problem in one role, one labor market, or one stage of the funnel. Position-level analysis is analytically honest because candidates don't apply to an abstract global average. They apply to specific jobs with specific requirements and competition.
Recent evidence makes the point sharper. A 2026 independent study found position-level racial disparities in hiring algorithms, with 25.87% of applications from Black candidates directed to jobs where outcomes triggered federal discrimination scrutiny, as described in [recent reporting on bias audits in hiring](https://www.warden-ai.com/resources/bias-audits-hiring). At the same time, other audit-based reporting from 2025 to 2026 found many systems meeting standard fairness thresholds. Those findings aren't mutually exclusive. A model can pass a broad audit while producing harmful outcomes in particular roles.
Build the audit around slices
For each assessment or AI-enabled hiring workflow, review:
This approach aligns with the direction of modern oversight. The Equal Employment Opportunity Commission and Office of Federal Contract Compliance Programs remain relevant to employment discrimination risk. New York Local Law 144 adds requirements around automated employment decision tools, including bias audit expectations. The European Union AI Act classifies employment-related AI systems as high risk. These frameworks differ, but they point toward documentation, accountability, and evidence rather than vendor assurances.
When a fairness signal appears, don't immediately abandon the tool or ignore the result. Pause the affected use case, investigate item behavior and workflow effects, review whether the role definition is defensible, and determine whether mitigation is possible. A fairness issue can originate in the assessment, the training data, the threshold, the recruiter workflow, or the labor market itself.
Set minimum evidence by use case
High-volume hiring requires subgroup reliability, position-level adverse impact monitoring, clear scoring logic, and a local validation plan. The typical failure is operational scale without oversight. A tool gets integrated into the applicant workflow, and the organization discovers too late that one job family receives systematically different outcomes.
Leadership assessment requires construct coverage, evidence tied to leadership behaviors, structured interpretation, and human review. The common failure is treating a broad leadership index as a promotion verdict, exactly as the opening scenario demonstrated.
Internal mobility requires comparable scoring across roles and evidence that employees aren't penalized by unfamiliarity with the assessment format or unequal access to preparation. The failure mode is false objectivity, where a numeric score appears neutral while reflecting differences in opportunity or context.
Team design requires aggregated reporting, privacy controls, compatibility analysis, and careful boundaries around individual inference. The typical failure is turning a team profile into a personality label rather than using it to guide working agreements, role clarity, and development.
For practical guidance on [pre hire assessment design and scoring](https://www.overvue.ai/post/pre-hire-assessment-a-complete-hiring-guide-for-2026), use the material as a starting point, then demand evidence specific to your own jobs and populations.
Use this vendor checklist
Before signing or expanding a psychometric or AI hiring program, require answers to these 12 questions:
1. Target sample: What sample size supports the claims for our target population? 2. Score scale: Are scores interval-level or merely ordinal rankings? 3. Local validation: Will the vendor support validation in our roles and operating context? 4. Subgroup reliability: Will reliability be reported for relevant groups? 5. Technical manual: Do we have the right to inspect the full manual and supporting evidence? 6. Construct definition: What exactly does each scale measure, and what does it not measure? 7. Factor structure: Has the structure been tested across relevant populations? 8. Fairness slices: Are audits conducted by position, location, recruiter, and selection stage? 9. Outcome linkage: Can scores connect to defined post-hire outcomes? 10. ATS integration: Can the system integrate with the ATS without losing audit fields or decision history? 11. Human review: Where does human judgment remain mandatory, and how is override behavior logged? 12. Ongoing monitoring: Does the contract commit the vendor to continued monitoring, documentation, and access to relevant audit results?
These aren't premium requirements. They're baseline controls for any system that influences access to employment.
--- Synopsix helps HR teams turn validated behavioral assessments into comparable profiles, role-specific intelligence reports, predictive simulations, compatibility analysis, and development plans. Visit [Synopsix](https://synopsix.ai) to connect psychometric evidence with practical hiring, team design, and talent decisions.