Retention Risk Assessment: A Practical HR Playbook
By Synopsix · October 2, 2026 · 17 min read
More dashboards won't solve employee turnover. A retention risk assessment becomes useful only when it helps leaders decide which people or cohorts face a specific risk, which drivers are controllable, and what intervention should happen next. A ranked list of employees without an action plan is reporting, not retention strategy.
The practical difference is substantial. In a 2024 retention report, more than 27% of U.S. workers quit their jobs in 2023, while less than 10% identified pay as the core reason and career development represented the largest category at 17.5% ([2024 retention report](https://www.ijcrt.org/papers/IJCRT2510313.pdf)). That pattern makes a company-wide score especially dangerous. It can direct attention toward compensation while missing blocked advancement, poor manager relationships, workload imbalance, or perceived internal unfairness.
Why Most Retention Programs Fail Before They Start
The popular advice is to collect more data, build a dashboard, and flag everyone who looks likely to leave. That approach fails before the model is even evaluated. Organizations often produce a large population of “at-risk” employees, then discover that managers don't know whether to change pay, redesign work, offer development, address a manager relationship, or do nothing.
The underlying mistake is treating retention as a scoring exercise rather than a decision discipline. A useful retention risk assessment should answer a bounded business question, connect multiple data sources, test predictions against actual terminations, and separate cohorts by the drivers leaders can influence. A revenue-critical sales group with weak promotion visibility requires a different response from a technical team experiencing project overload.
A company-wide score may still have value as an overview, but it isn't a strategy. The score should lead to a decision about a role family, location, manager population, tenure group, or other meaningful cohort. Teams that want a broader introduction to the measurement side can use this [guide to employee retention rates](https://synopsix.ai/blog/employee-retention-rates), but the operational question remains the same: what action follows the signal?
Reporting is not intervention
Historical turnover rates, average tenure, and headcount ratios remain useful. They show where the organization has experienced pressure. They don't explain which lever will change the next outcome, and they don't tell a manager whether the right response is an internal move, a workload adjustment, a pay correction, or a conversation about career direction.
A stronger program moves through a deliberate sequence:
> The central rule: Don't ask who is at risk in the abstract. Ask which cohort is at risk, why that risk exists, and what the organization can change.
Defining Objectives and Assembling Your Data Foundation
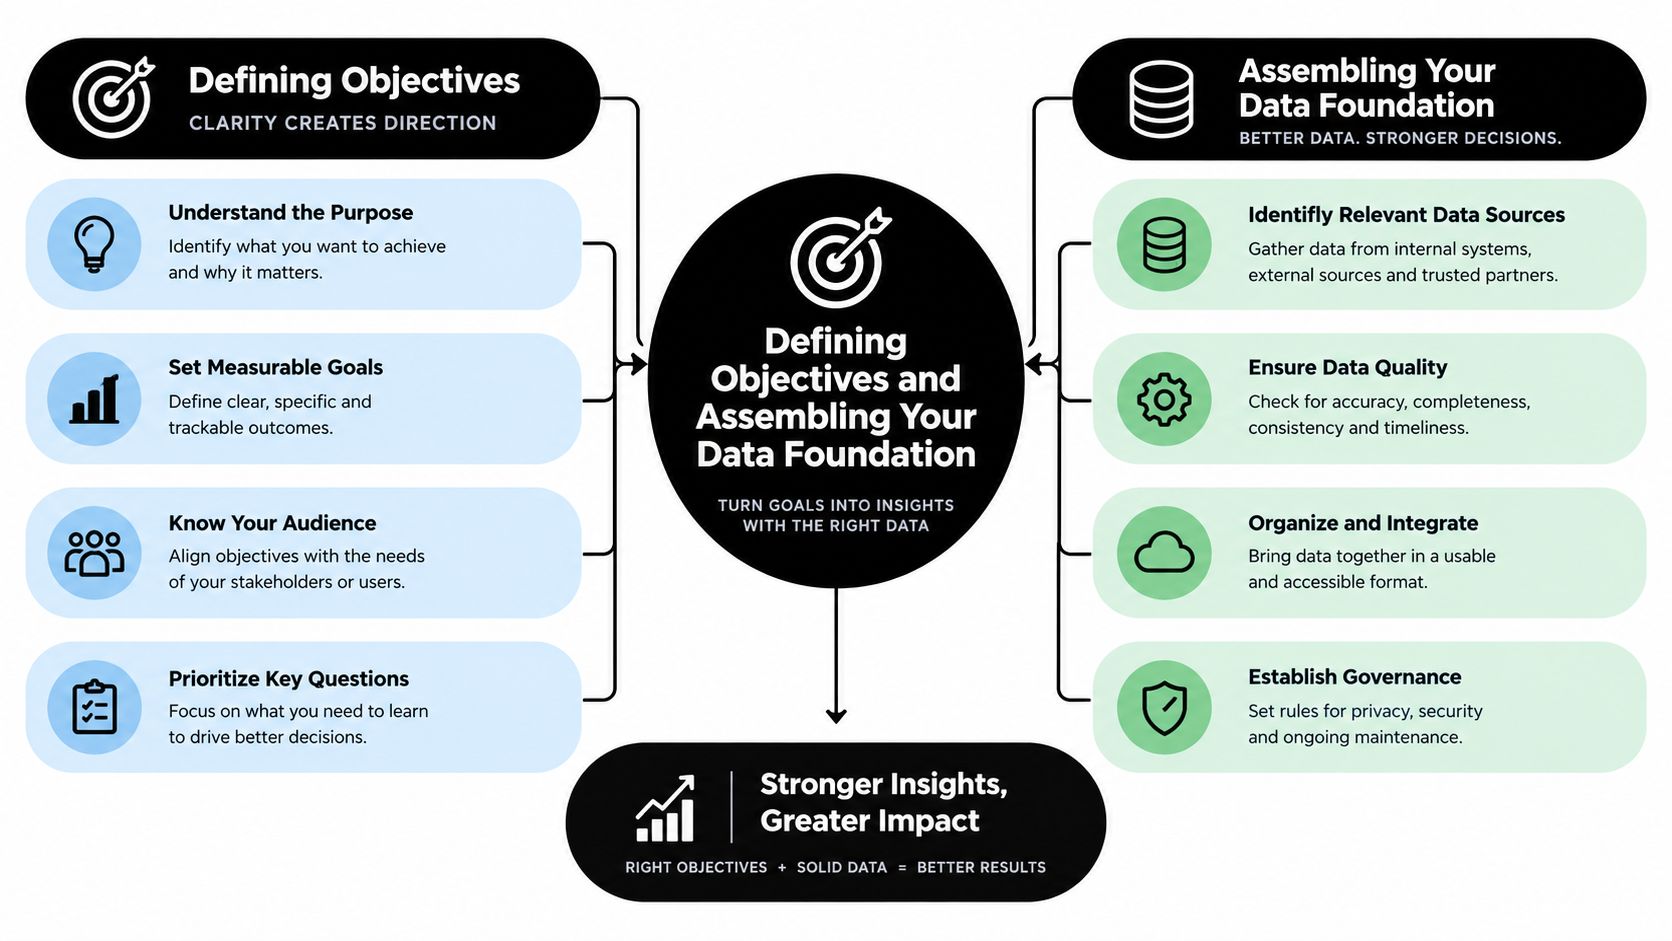
Before choosing an algorithm, write the decision in plain language. “Predict turnover” is too broad. A usable objective might be: identify regrettable voluntary attrition risk among revenue-critical roles early enough for leaders to offer a credible development or workload intervention.
That statement forces several choices:
1. Which exits count? Voluntary departures, regrettable departures, all exits, or exits from particular roles? 2. Who is in scope? Every employee, a role family, a business unit, a geography, or a tenure segment? 3. What is the horizon? The organization might need a near-term alert, a longer planning signal, or both. 4. What decision will change? If no intervention is available, a prediction may create anxiety without creating value. 5. Who owns the response? HR, the manager, compensation, learning and development, or an executive sponsor?
Consider a mid-size company that starts with every employee in the model. That scope may produce a polished dashboard but weak prioritization. A better first release could focus on revenue-critical sales and customer-success roles, define voluntary regrettable exits as the outcome, and give leaders a clear menu of responses. Once the organization can show that the data, workflow, and governance hold together, it can expand carefully.
Build the input layer with skepticism
The data foundation usually spans several systems, and each source carries a different kind of risk.
Data hygiene is where many projects lose credibility. Missing promotion dates, duplicate employee identifiers, rehires treated as new employees, and termination codes that mix voluntary and involuntary exits can all produce false relationships. Create a data dictionary, record the time at which each field became available, and preserve a clear audit trail for every transformation.
A 2021 KPMG discussion described retention risk analysis as a statistical method that uses historical employee and rewards data to calculate each worker's probability of voluntary departure, recommending 3–5 years of history at minimum to validate the model against actual terminations ([KPMG discussion of retention risk analysis](https://assets.kpmg.com/content/dam/kpmg/xx/pdf/2021/04/podcast-transcript-retainig-key-talent-through-data-insight.pdf)). The exact period won't fit every organization, but the principle does. You need enough historical variation to test whether the signal survives different managers, business conditions, and hiring cohorts.
For a broader view of how workforce data supports decision-making, compare the data foundation with this practical resource on [people analytics in HR](https://synopsix.ai/blog/people-analytics-in-hr). The important test isn't how many fields the team can ingest. It's whether each field has a defensible definition, a usable time relationship to the outcome, and an owner who can correct it.
Building and Validating a Retention Risk Model That Actually Works
Most HR leaders don't need to write the code, but they do need to challenge the evaluation. A model that predicts whether someone leaves eventually is less useful than one that estimates when risk is likely to materialize. Survival analysis and time-to-event methods are better suited to that question because they account for employees who haven't left yet and estimate the timing of an event rather than forcing every person into a simple leave or stay category.
The validation process should mirror the decision environment. Train on earlier records, test on later records, and avoid allowing future information into the features. Repeated K-fold cross-validation can help test stability, while the concordance index evaluates how well the model ranks people by event timing. One study reported a concordance index of 0.83 and described a workflow using Kaplan-Meier analysis, Cox proportional hazards, and Random Survival Forests for retention prediction ([survival analysis retention study](https://pdfs.semanticscholar.org/b307/1c560f554d0c81a8b0f4d910deb4e8af8d27.pdf)).
The accuracy trap
Executives often ask for accuracy because it sounds intuitive. In imbalanced attrition data, however, most employees may stay, so a model can predict “stay” frequently and still miss the employees leaders actually need to reach.
Benchmark results make the trade-off visible. One study reported logistic regression ROC AUC of 0.822 and PR AUC of 0.574. Another reported AUC of 0.796 with XGBoost and 0.785 with CatBoost. A Random Forest model recorded 87.76% overall accuracy but only 0.15 recall for employees likely to leave ([attrition model benchmarks](https://www.mdpi.com/2071-1050/18/6/2740)). That last result is the warning: high overall accuracy can coexist with very poor identification of true leavers.
| Model / Approach | Reported Strength | Hidden Weakness | What It Means for You | |---|---|---|---| | Logistic regression | ROC AUC 0.822 | PR AUC was 0.574 | A model can rank reasonably well while performing less strongly on the minority class that matters operationally. | | XGBoost | AUC 0.796 | AUC alone doesn't show intervention capacity | Use threshold and cohort analysis before presenting the result as business value. | | CatBoost | AUC 0.785 | Similar discrimination limits apply | Compare stability, explainability, and operational fit rather than chasing a marginal metric difference. | | Random Forest | 87.76% overall accuracy | Recall was only 0.15 for likely leavers | Accuracy can conceal failure to find the people the retention program needs to contact. |
Don't promise executives that the model will “predict resignations.” Present it as a prioritization signal with uncertainty, then show recall, precision, calibration, cohort performance, and false-positive cost. If the model flags too many people, managers stop trusting it. If it flags too few, the program misses preventable exits. Thresholds should reflect intervention capacity and the cost of each error, not a convenient default.
Use tools such as [predictive modeling guidance](https://synopsix.ai/blog/what-is-predictive-modeling) to frame the technical conversation, but keep ownership with HR and business leaders. A statistically sound model can still fail if the organization can't act on its output.
Scoring Employees and Segmenting by Controllable Risk Drivers
A validated model should produce more than an individual score. It should show risk level, likely timing, influential drivers, confidence, and the cohort context. Aggregate those signals at team and department level, but don't replace individual context with averages. A team may show moderate risk overall while a small group of high-performing specialists faces concentrated career stagnation.
The translation layer is segmentation. Start by separating drivers the organization can change from conditions it can only acknowledge. Compensation equity, promotion visibility, workload allocation, manager behavior, role design, and development access are usually intervention candidates. Personal circumstances, external labor-market changes, or an employee's private plans may be relevant but aren't levers a manager should attempt to control.
Pair model output with human evidence
Quantitative indicators should be combined with qualitative inputs. Attrition trends, regrettable exits, tenure patterns, pay-band position, project assignments, and promotion history can identify a cohort. Stay interviews and manager intelligence can then test whether the proposed explanation matches lived experience.
Use a consistent interview structure. Ask what might cause the employee to leave, what would make the role more sustainable, which opportunities feel unavailable, and whether the manager understands the employee's goals. Don't feed the employee's risk score into the conversation. The interview should gather evidence, not confirm a label.
A study using 14,999 employees found that voluntary turnover risk wasn't linear across workload. Two projects or six or more projects were identified as risk points, alongside job satisfaction, years at the company, work-life balance, and compensation as key predictors ([HR analytics workload study](https://pdfs.semanticscholar.org/9e32/f30292d14e7afa224a720541590b6130a0b3.pdf)). The result is operationally important because “more work causes more risk” is too simple. Too little meaningful work can signal exclusion or stalled growth, while too much can signal overload.
For teams investigating workload risk, practical guidance on [redesigning workloads for wellbeing](https://revibementalhealth.com/employee-burnout-prevention/) can complement the analytics. The model identifies a pattern. Leaders still need to redesign work, clarify priorities, and check whether the new arrangement improves the employee's experience.
<iframe width="100%" style="aspect-ratio: 16 / 9;" src="https://www.youtube.com/embed/CBMVbY1uLMM" frameborder="0" allow="autoplay; encrypted-media" allowfullscreen></iframe>
A useful cohort record might read: “Customer-success specialists with raised voluntary-exit risk, limited lateral opportunities, and inconsistent manager career conversations.” That description is more actionable than “high risk.” It points toward a development and manager intervention, while preserving room to test whether the diagnosis is correct.
Running Predictive Simulations and Prioritizing High-Risk Cohorts
Not every flagged cohort deserves the same budget. Prioritization should compare three different choices: address the individuals with the highest scores, address the cohort with the most controllable drivers, or address the structural cause creating risk across the future workforce.
The first option is easy to explain. HR can give managers a short list and ask for conversations. It may work when a small number of critical employees face a clear and immediate issue. It also creates inconsistency if managers offer special treatment without fixing the role, pay structure, or promotion process around them.
The second option targets a cohort. For example, leaders might focus on employees at a particular level who have stalled progression, weak lateral-move visibility, and a history of strong performance. This approach can produce a repeatable intervention, but it may require more coordination across talent, compensation, and business leadership.
The third option addresses the structural source. A redesign of career architecture, manager expectations, or project allocation may reduce future risk more effectively than a series of individual counteroffers. It takes longer and can be harder to attribute, but it avoids treating each resignation as an isolated event.
Stress-test the intervention before spending
Predictive simulations let teams test scenarios such as a promotion pathway, a pay-band correction, a team redesign, or a workload change against the risk signal. The output isn't a guarantee. It's a structured way to ask whether a proposed action addresses the drivers associated with the cohort.
Internal equity deserves particular attention. Neutral 2026 guidance recommends checking pay bands, pay equity audits, compression, internal parity, and lateral-move visibility. Employees may leave because they perceive unfairness or blocked growth inside the organization, even when market benchmarking shows that compensation is competitive. That means a high-risk population can remain hidden inside a program that looks healthy from an external-pay perspective.
Compare scenarios using consistent criteria:
A simulation should narrow the decision, not replace judgment. If the model predicts that a bonus affects little beyond a short-term score movement, leaders should examine development access, pay compression, or manager practices instead.
Designing Targeted Interventions and Development Plans
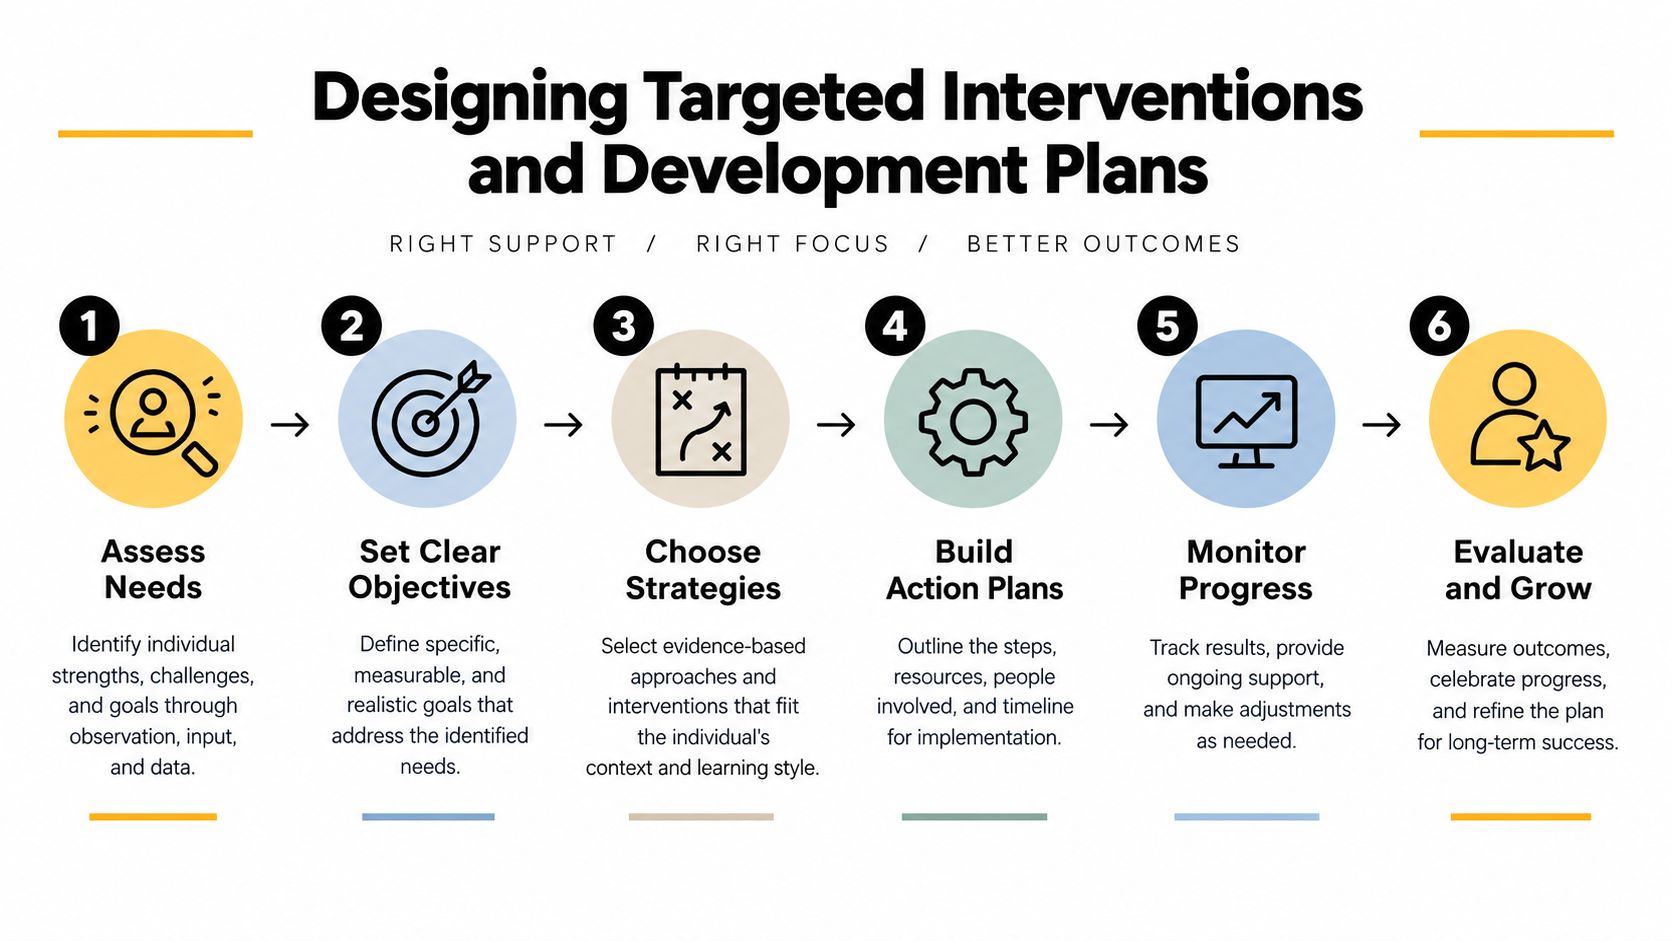
Interventions work best when they match the driver and carry a testable hypothesis. “Improve engagement” isn't a hypothesis. “Employees in this role family will show lower near-term risk after receiving a documented lateral-move path and a manager-led career conversation” is specific enough to monitor.
Career stagnation
Make progression visible. Give employees documented expectations for the next role, examples of evidence required, likely decision-makers, and realistic lateral options when vertical promotion isn't immediately available. A development plan should name the experience, project, mentor, or capability the employee will build, along with a review date.
One study found that employees who left within the next year rated career advancement opportunities significantly lower. Among 12 candidate wellbeing indicators, career advancement opportunities were one of only three significant or marginally significant predictors of turnover within 12 months ([study of wellbeing indicators and turnover](https://pmc.ncbi.nlm.nih.gov/articles/PMC13488952/)). That supports a practical response: treat career visibility as a retention lever, not a vague benefit.
Equity and compression
Review pay-band placement, internal comparators, recent increases, and differences between newer hires and established employees. Correcting compression may require more than a one-time adjustment. Explain the logic behind pay decisions, document exceptions, and make promotion criteria easier to understand.
Workload imbalance
Don't wait for burnout language to appear in an engagement survey. Review project allocation, role capacity, meeting load, priority conflicts, and whether employees have enough meaningful work. Rebalance assignments, remove low-value work, and check whether managers are rewarding overload as a proxy for commitment.
Manager-driven risk
Start with manager coaching and a focused team diagnosis. Clarify expectations around feedback, career conversations, recognition, and conflict. Replacing the employee may be the wrong response when the organization can repair the working relationship or change the team's operating model.
For a complementary set of practical retention actions, this [guide to cutting absenteeism and turnover](https://www.leavewizard.com/how-to-reduce-employee-turnover-proven-strategies-for-retaining-top-talent/) can help teams connect retention work with attendance and workforce planning. The intervention still needs to remain cohort-specific.
Avoid one-size-fits-all retention bonuses. They can reward employees for appearing in a risk list without fixing the reason they might leave, and they can create equity concerns among people facing the same structural problem. Pair every action with an owner, a time-bound hypothesis, an employee-experience measure, and an outcome measure.
Monitoring, Governance, and Your Implementation Checklist
A retention risk assessment becomes sustainable when leaders treat it as an operating process rather than a model launch. The discipline evolved from descriptive measures such as turnover rates and tenure into predictive models that assign individual risk scores and aggregate them at team level, making it a distinct analytic field rather than a reporting exercise ([history of workforce analytics and retention prediction](https://ijetrm.com/issues/files/Aug-2017-08-1754622239-MAY201706.pdf)).
Use a cadence that matches the speed of the decisions:
The KPI set should stay close to decisions. Track regrettable attrition rate, intervention uptake, the retention delta for high-risk cohorts, and recall on actual leavers. Also monitor false positives and employee feedback. A model that finds risk but causes managers to overreact can damage trust even if its statistical metrics look acceptable.
Governance rules that prevent harm
Restrict individual-level scores to people with a legitimate business need. Most managers need a conversation guide and driver summary, not a probability value. Explain that the signal supports support and development, not disciplinary action or automatic employment decisions.
Create a documented process for access, correction, appeals, retention of personal data, and model review. HR, legal, privacy, analytics, compensation, and business leaders should agree on ownership before launch. Executives need plain language: which cohort is exposed, what evidence supports that diagnosis, what action is funded, and how success will be judged.
Use this checklist to start:
---
Synopsix helps HR teams turn behavioral assessments and people data into practical guidance for talent development, team design, predictive simulations, and retention decisions. Use [Synopsix](https://synopsix.ai) to identify where talent risk may sit and translate those signals into clearer development and intervention plans.