Mastering Talent Acquisition Metrics: 2026 Guide
By Synopsix · July 5, 2026 · 18 min read
Most advice on talent acquisition metrics is backwards. It treats recruiting like a speed contest, then celebrates lower time-to-fill, more applicants, or a cleaner funnel without asking the only question that matters. Did the business get stronger because of the hire?
That's how teams end up presenting polished dashboards that look efficient while managers deal with weak ramp-up, poor fit, and early exits. A low cycle time can coexist with a bad hiring system. A cheap hire can still become an expensive mistake. If your metrics only describe process activity, they're not guiding decisions. They're documenting motion.
The better approach is to treat talent acquisition metrics as a decision system. Start with the operational numbers every team needs. Then add the missing layer that explains why some people ramp fast, collaborate well, and stick, while others struggle even when their résumé looked strong. That's the difference between reporting and prediction, and it's where people intelligence starts to matter.
Why Most Talent Acquisition Metrics Fail
The standard advice says to track everything. Time-to-fill. cost per hire. application volume. interview counts. offer acceptance. source mix. That sounds disciplined, but it often creates the wrong behavior.
Recruiters respond to the dashboard they're given. If leadership rewards speed, teams push speed. If leadership rewards low spend, teams cut cost. If leadership rewards volume, recruiters stuff the funnel. None of those targets guarantees a better hire.

Efficiency isn't the same as effectiveness
A recruiting function can hit internal SLAs and still fail the business. I've seen teams celebrate shorter hiring cycles while hiring managers complain that new employees need too much support or leave before they contribute at the expected level. The dashboard says green. The business feels red.
That happens because most common talent acquisition metrics are lagging process indicators. They tell you what happened inside the funnel. They rarely tell you whether the person hired will succeed in the role, on that team, under that manager, in that environment.
> Most recruiting dashboards measure throughput. Leaders need metrics that measure business contribution.
The best example is quality of hire. It's widely seen as the most strategic talent acquisition metric, but many organizations still struggle to define and measure it consistently. According to [ZRG's talent acquisition outlook](https://www.zrgpartners.com/insights/talent-acquisiton-in-2025), 73% of HR leaders consider quality of hire a critical metric, yet only 35% have a standardized process to track it.
The usual failure pattern
The breakdown is usually predictable:
A useful metric has to change a decision. If it doesn't help a recruiter screen better, a hiring manager calibrate better, or a CHRO invest better, it's decoration.
What better looks like
A strong metrics model separates two things:
| Type | What it tells you | Typical use | |---|---|---| | Process metrics | How efficiently the funnel moved | Recruiter operations | | Outcome metrics | Whether hiring improved business performance | Leadership decisions |
You still need process metrics. You just can't mistake them for proof of hiring success. The recruiting teams that mature fastest stop asking, “How fast did we hire?” and start asking, “What early signals told us this person would perform, stay, and add value?”
The Four Core Talent Acquisition Metrics
Four metrics show up in almost every recruiting dashboard. The problem is not their inclusion. The problem is how often teams treat them as proof of hiring success when they only describe parts of the process. Used well, these metrics create a decision baseline. Used poorly, they produce fast reporting and weak hiring.
The core set is straightforward:
1. Quality of hire 2. Cost per hire 3. Time to fill 4. Source of hire effectiveness
These are still the right starting points. They just need to be read as a system, not as isolated scorecards.
Core Talent Acquisition Metrics Reference
| Metric | Formula | What It Measures | Industry Benchmark | |---|---|---|---| | Quality of hire | Composite of first-year performance ratings + hiring manager satisfaction + first-year retention | Long-term value of a new hire | Consistent tracking has been linked to fewer mis-hires and stronger team productivity, according to [LinkedIn's recruiting metrics guidance](https://www.linkedin.com/top-content/recruitment-hr/analyzing-recruitment-metrics/key-metrics-to-track-for-effective-talent-acquisition/) | | Cost per hire | (Internal recruiting costs + external fees + advertising + onboarding costs) / total hires | Financial efficiency of filling roles | Best read alongside ramp time and early attrition, because direct hiring spend rarely reflects full hiring cost | | Time to fill | Days from approved requisition to accepted offer | How long the business waits to secure talent | Best interpreted by role family, seniority, and labor market conditions rather than one universal target | | Source of hire effectiveness | Hires or quality hires generated by channel / total hires from that channel, paired with channel cost | Which sourcing channels produce results worth the spend | Best evaluated by combining conversion, quality, and cost rather than volume alone |
Quality of hire
If leadership wants one metric that connects recruiting to business performance, start here.
Quality of hire should be a composite score. In practice, that usually means combining first-year performance, hiring manager satisfaction, and first-year retention. Some teams also include time to productivity. I support that addition when the role has a clear ramp curve and the business can measure it cleanly. If not, keep the model tighter and more defensible.
Useful inputs usually come from:
The trade-off is speed versus credibility. A simpler quality-of-hire score is easier to launch. A stronger one takes cross-functional agreement and better data hygiene. Start with a version you can govern, then improve it.
> Practical rule: If quality of hire is not visible beside source and cost data, recruiting teams will keep rewarding channels that create activity rather than channels that produce strong hires.
Cost per hire
Cost per hire gets distorted when teams treat invoice totals as the whole story. Recruiter capacity, agency spend, advertising, and onboarding expenses matter, but they only capture acquisition cost. They do not capture whether the business bought a good outcome.
The more useful view adds ramp and early failure cost. Training time, manager coaching load, backfill risk, and exits inside the first year all change the economics of a hire. A low-cost hire who takes too long to contribute, or leaves before reaching stable performance, is not efficient. It is expensive in a less visible way.
This is why I rarely review cost per hire alone. I want to see it next to quality of hire and, where possible, time to productivity.
Time to fill
Time to fill still matters because vacancies create real operating drag. Sales teams miss coverage. Engineering work slips. Managers absorb extra work and burn time in interviews.
What this metric cannot do is serve as a universal target across every role. A hard-to-find data scientist and a high-volume support hire should not be managed to the same clock. The right comparison is within role family, level, and market conditions.
Teams trying to improve process discipline should track stage delays separately from overall cycle time. [Recruitment efficiency metrics](https://synopsix.ai/blog/recruitment-efficiency-metrics) are useful here, especially when they show whether delays come from sourcing, scheduling, assessment design, or offer approval. That is how time data becomes operationally useful instead of becoming pressure to rush decisions.
Source of hire effectiveness
Source reporting breaks down when teams stop at applicant volume or total hires. Those numbers are easy to produce and easy to misread. A source can flood the funnel and still damage hiring quality.
A better source analysis uses four layers:
The limitations of traditional metric sets become apparent. Source effectiveness only becomes strategically useful when you can connect channels to downstream outcomes, not just funnel movement. If employee referrals produce fewer applicants but stronger retention and manager satisfaction, they are outperforming a high-volume job board. If an agency fills roles quickly but those hires miss performance expectations, the channel is underdelivering even if time to fill looks good.
That distinction matters. It is the difference between measuring recruiting activity and measuring hiring value.
Building Your TA Metrics Dashboard
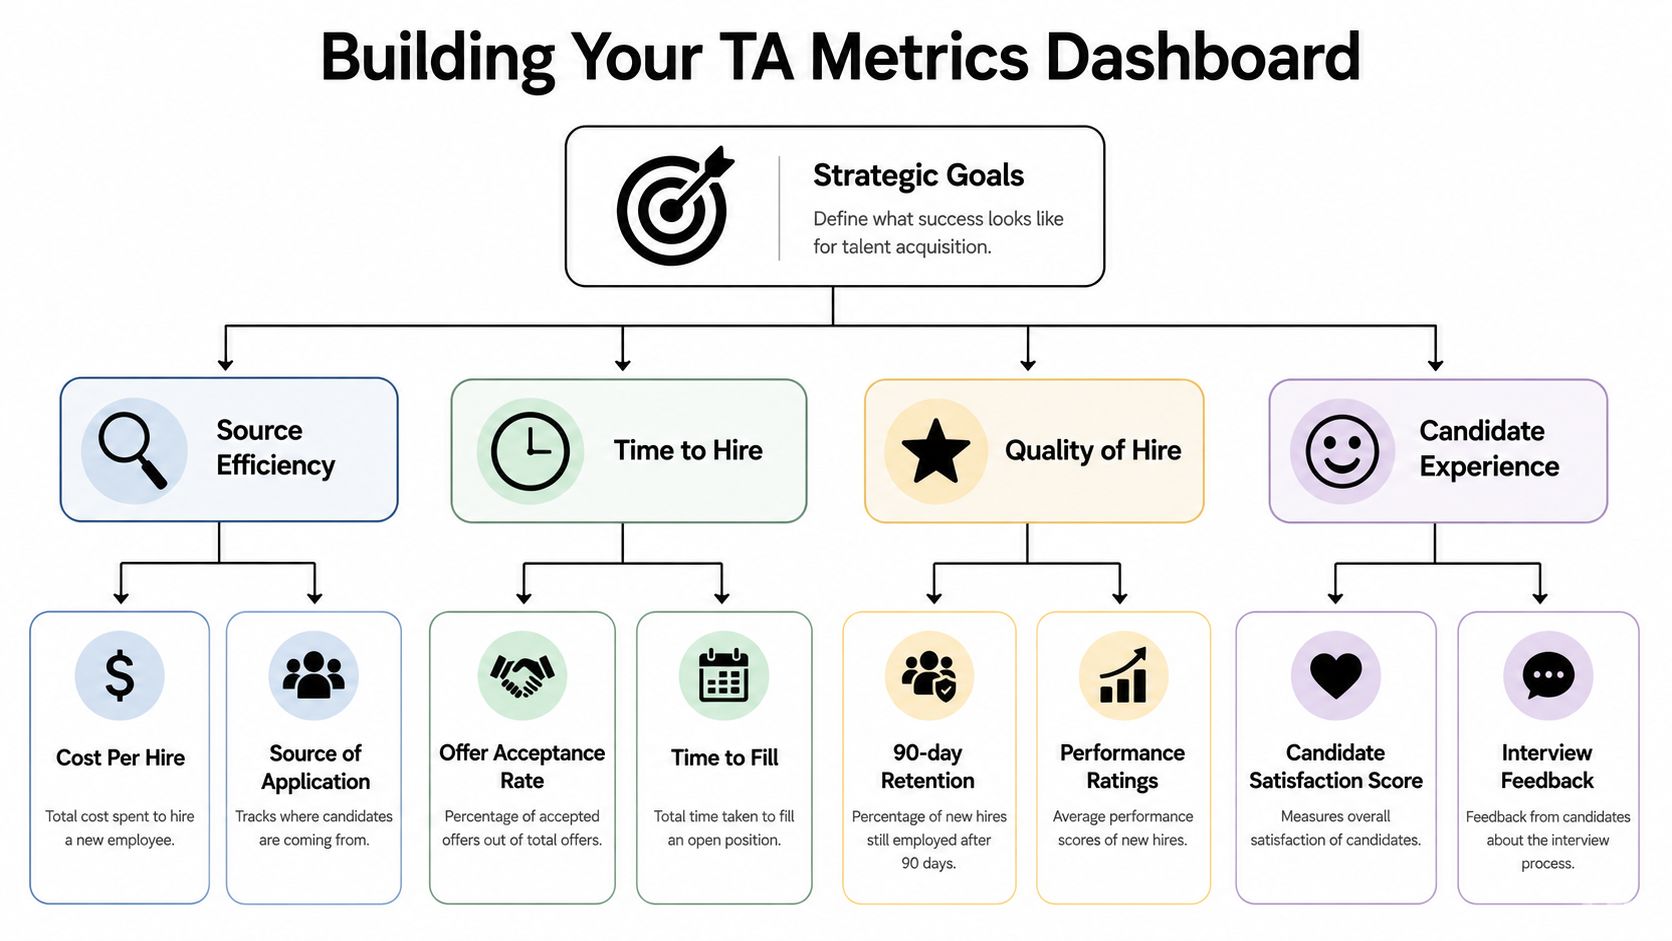
A dashboard should do two jobs. It should help recruiters run the process day to day, and it should help leadership understand whether hiring decisions are improving workforce performance. Most companies mash those two jobs together and end up serving neither audience well.
The fix is simple. Build two layers in one reporting model: an operational view for weekly action and a strategic view for quarterly decisions.
What the operational dashboard should show
Recruiters and recruiting managers need visibility into bottlenecks they can fix. That means stage movement, scheduling delays, screening outcomes, and conversion rates by role and by recruiter.
One of the most useful diagnostic measures is the interview-to-offer ratio. According to [Lever's talent acquisition metrics benchmark](https://www.lever.co/blog/talent-acquisition-metrics), the optimal range is 15% to 25%, and a rate below 10% often signals adverse assessment bias or poor candidate-job fit alignment.
If that ratio drops, don't jump straight to “the market is harder.” Inspect the process.
#### Diagnostic questions worth asking
Scheduling deserves separate attention. It's a controllable piece of time-to-hire, and when teams isolate it, they usually find waste that had been hiding inside a broad cycle-time number.
What the strategic dashboard should show
Executives don't need stage-by-stage detail. They need a compact view of hiring as a business lever. That dashboard should connect:
> A dashboard becomes strategic when it helps leaders decide where to invest, where to intervene, and which hiring patterns create repeatable value.
The underlying data usually comes from three systems. The ATS tracks funnel movement and source. The HRIS tracks starts, exits, and tenure. The performance system captures post-hire outcomes. If those systems aren't aligned by candidate ID or employee ID, the analytics team will spend more time reconciling than analyzing.
A practical build sequence
Don't try to perfect the final dashboard on day one. Start in this order:
1. Unify definitions: Agree on what counts as time to fill, a source, a quality hire, and an active requisition. 2. Connect systems: Map the ATS to the HRIS first. Add performance data next. 3. Design by audience: Build recruiter views and executive views separately. 4. Add diagnostic logic: Flag outlier conversion rates, long scheduling delays, and inconsistent manager feedback.
Good dashboards don't just display metrics. They point people toward the next question.
From Lagging Indicators to Predictive Insights
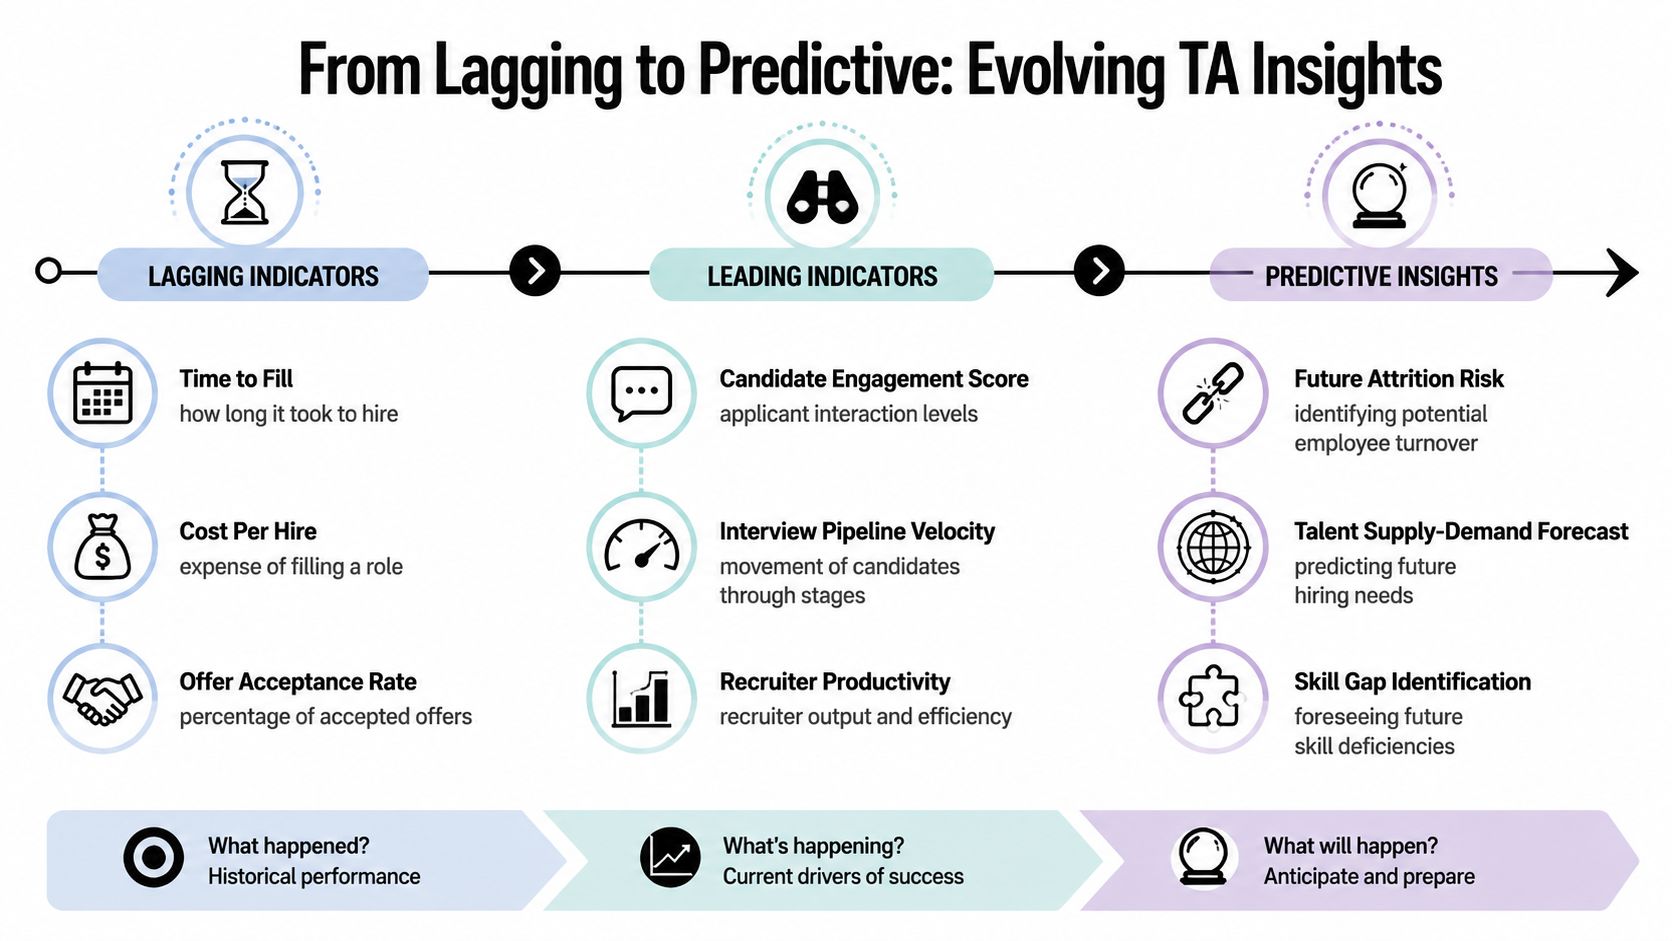
Most TA dashboards still look backward. They tell you what already happened after the cost has already landed. The hire started. The manager formed an opinion. The annual review showed mixed performance. Retention data arrived too late to prevent the mistake.
That's useful for reporting. It's weak for intervention.
Why lagging metrics create delayed learning
Quality-of-hire models often depend on the 12-month performance cycle. That's too late if the person struggled from month one. By then, the manager has spent time coaching, the team has absorbed the friction, and the role has already affected delivery.
A better system adds leading indicators that show whether a hire is likely to create value sooner. The most important one is time-to-full-productivity. As noted in [Zenhire's review of TA metrics](https://zenhire.ai/talent-acquisition/metrics), it is frequently not treated as a distinct lead metric even though it directly relates to revenue loss.
That same source also highlights a major assessment issue: unstructured interviews show about 0.18 validity against later performance, while structured interviews with behavioral assessments reach 0.6. That gap matters because many hiring teams still trust instinct-heavy interviews that feel rigorous but predict very little.
What predictive talent acquisition metrics look like
Predictive metrics don't replace the core four. They sit on top of them and sharpen decision quality.
Examples include:
This is the same logic operations leaders use in other functions. They don't wait for quarterly misses to discover a production issue. They track early indicators. The same principle shows up outside HR in work like [Optimizing logistics with Python](https://www.faberwork.com/latest-thinking/enhancing-logistics-with-python-data-analytics), where teams use process data to detect friction before it turns into larger cost or service problems.
What to change first
Start with the interview process. If interviews are still mostly conversational and interviewer-dependent, your data will stay noisy because the inputs are unstable. Then define productivity in role-specific terms. Don't ask whether someone is “doing well.” Ask what observable behaviors or outputs indicate they are ramping as expected.
For a broader view of how these methods fit into people decision-making, [predictive analytics in HR](https://synopsix.ai/blog/predictive-analytics-in-hr) is the right frame. The point isn't forecasting for its own sake. The point is making earlier, better decisions with less guesswork.
> The most valuable hiring metric is often the earliest one that tells you the hire is off track.
The Missing Layer People Intelligence Data
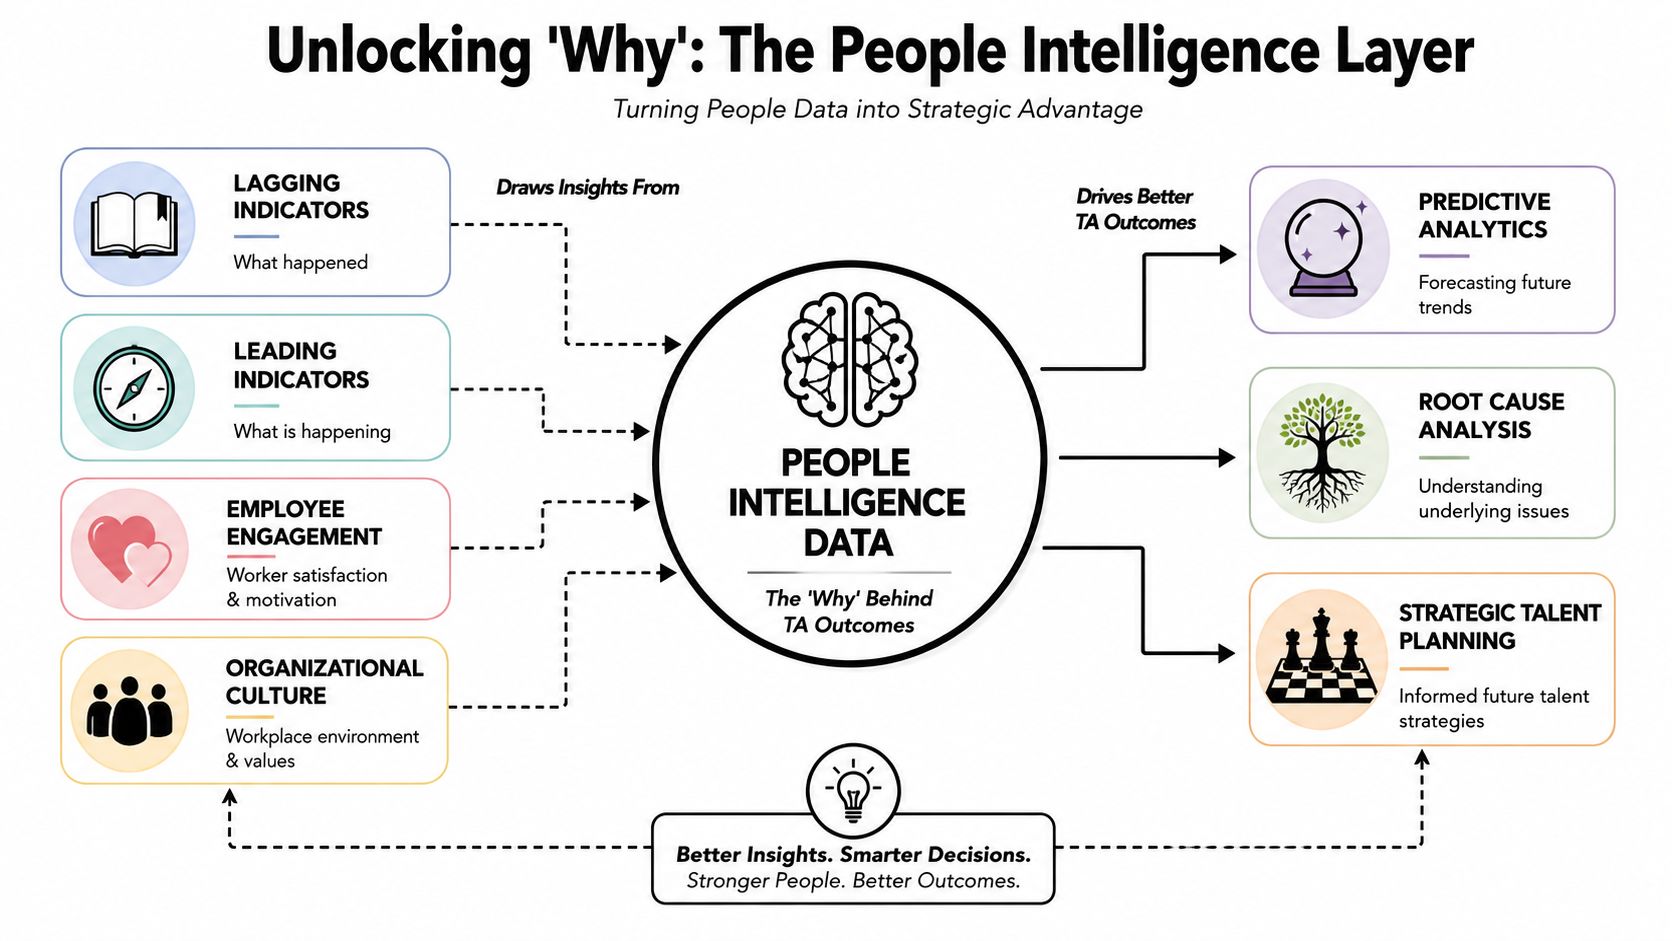
Even strong leading indicators still leave a gap. They show what is happening sooner, but they don't always explain why. Why did one hire ramp quickly under the same manager while another stalled? Why did a candidate with strong technical credentials create friction inside the team? Why do some hires look strong in process and then struggle in role?
That's where people intelligence data becomes useful. It adds a behavioral layer to talent acquisition metrics, so teams can move from description to explanation.
Metrics tell you the symptom
A standard dashboard can show that a sales hire had a slow ramp, that a manager gave low fit scores, or that early turnover rose in one team. Useful, but incomplete.
Behavioral data helps test the underlying cause. Was the issue role fit, manager compatibility, collaboration style, tolerance for ambiguity, or a mismatch between the person's working preferences and the actual demands of the job? Without that layer, leaders often blame sourcing quality when the actual issue is a poor match between person, role, and team context.
> Good analytics identifies the broken result. Better analytics identifies the mechanism behind it.
This is also where talent teams need discipline about adjacent controls. Behavioral insight should complement, not replace, verification and risk checks. In sensitive hiring contexts, solid [employment screening](https://www.sentryprivateinvestigators.co.uk/private-investigator-background-checks) still plays a practical role alongside assessment and structured evaluation.
Why finance teams keep pushing back
CHROs and TA leaders often run into the same objection from finance. Behavioral assessments sound interesting, but where's the business case?
That challenge is real. According to [Visier's discussion of strategic talent acquisition metrics](https://www.visier.com/blog/strategic-talent-acquisition-metrics/), a common unresolved question is how to connect psychometric profiles to hard financial outcomes. The same piece notes emerging frameworks that suggest tracking new hire failure rate and dollars of revenue lost due to vacancy days by mapping behavioral compatibility scores to those revenue lines.
That's the right direction because it changes the conversation. Instead of saying, “This candidate seems like a fit,” teams can ask more concrete questions:
Here's a useful primer before teams operationalize that kind of model: [what talent intelligence means in practice](https://synopsix.ai/blog/what-is-talent-intelligence).
What people intelligence changes in hiring practice
Used well, people intelligence improves several decisions at once.
A short explainer helps make this concrete:
<iframe width="100%" style="aspect-ratio: 16 / 9;" src="https://www.youtube.com/embed/wLEoUj0NKYA" frameborder="0" allow="autoplay; encrypted-media" allowfullscreen></iframe>
The practical value isn't abstract psychology. It's better operational judgment. When talent leaders can interpret behavior in business language, they stop treating hiring risk as mysterious.
A better way to read TA outcomes
Think about the pattern many teams see but can't explain. One department has good offer acceptance but weak early retention. Another has slower hiring but better manager satisfaction and cleaner ramp-up. Traditional metrics can show the difference. People intelligence helps explain why those patterns repeat.
That matters beyond acquisition. The same behavioral mismatches that show up in hiring often resurface later as manager conflict, team friction, or burnout. Leaders already thinking about broader people outcomes may find adjacent ideas around [supporting employee well-being](https://wordpress.detalks.com/corporate-employee-wellness/) useful, because hiring quality and employee experience are more connected than most dashboards admit.
Turning Metrics Into Strategic Action
Most talent teams don't need more metrics. They need fewer, better-connected metrics and a stricter operating model around them.
The shift starts when you stop treating the dashboard as a reporting artifact and start treating it as a management system. If a metric doesn't lead to a decision, remove it or demote it.
A four-step reset
1. Audit what you already track List every recruiting metric in your dashboard and ask a hard question. Does it measure motion, or does it help predict hiring success? Keep the core operational numbers, but identify where vanity has crowded out value.
2. Standardize the definitions If recruiters, HR business partners, and finance define metrics differently, your reporting will create noise. Align formulas, reporting windows, source rules, and quality criteria before you add anything more advanced.
3. Add leading indicators Bring in early signals such as ramp progress, structured interview quality, and early retention patterns. These are more useful than waiting for a year-end summary after the damage is already visible.
4. Layer in people intelligence This is what turns talent acquisition metrics into a more predictive system. It helps teams understand why some hires succeed in one environment and fail in another, which is exactly the insight leaders need when stakes are high.
> When TA leaders connect process data, hiring outcomes, and human behavior, recruiting stops looking like a cost center and starts operating like a strategic function.
The goal isn't perfect prediction. Hiring will always involve judgment. The goal is better judgment, applied earlier, with evidence strong enough to guide action.
---
If you want to turn assessment data into practical hiring, team design, and talent decisions, explore [Synopsix](https://synopsix.ai). It translates behavioral insight into business language, helping leaders make faster, more consistent people decisions with less guesswork.