What Is Predictive Validity? Forecasting Job Performance
By Synopsix · November 12, 2026 · 16 min read
Your shortlist is down to four names, and you've just added a fifth column to the spreadsheet: a behavioral assessment score. Two of the candidates you liked most scored in the middle. One you were ready to reject scored near the top. Now you have to decide whether that number says anything about what happens ninety days into the job.
Anyone asking what is predictive validity is really asking something narrower and more useful: does this score tell me anything about the person's first year? The answer is yes, sometimes, under conditions you can name and test. It is not a property of a test. It's a property of a test, a job, and a group of people, measured over time.
What follows is the definition in plain language, the designs that produce the evidence, the published numbers you're likely to run into, and the checks that separate a strong coefficient from a tool that earns a place in your process.
Predictive Validity in Plain Terms
Picture a hiring manager who runs an assessment on a Tuesday, makes an offer on Thursday, and then, eight months later, sits in a performance review wondering whether the person who scored 78 is outperforming the one who scored 61. The test felt scientific. The review feels subjective. Whether the first predicted the second is the entire question.
Predictive validity is the degree to which an assessment score forecasts a later, job-relevant outcome, such as a performance rating, sales results, or whether the person is still in the role at twelve months. A weather forecast is judged the same way: not by how confident the meteorologist sounds, but by whether the rain arrives when the forecast said it would. A forecast of 70% rain followed by a downpour did its job. A confident forecast of sunshine followed by a storm failed, no matter how well it was presented.
The relationship runs one direction in time, from a measure you take now to an outcome you observe later.
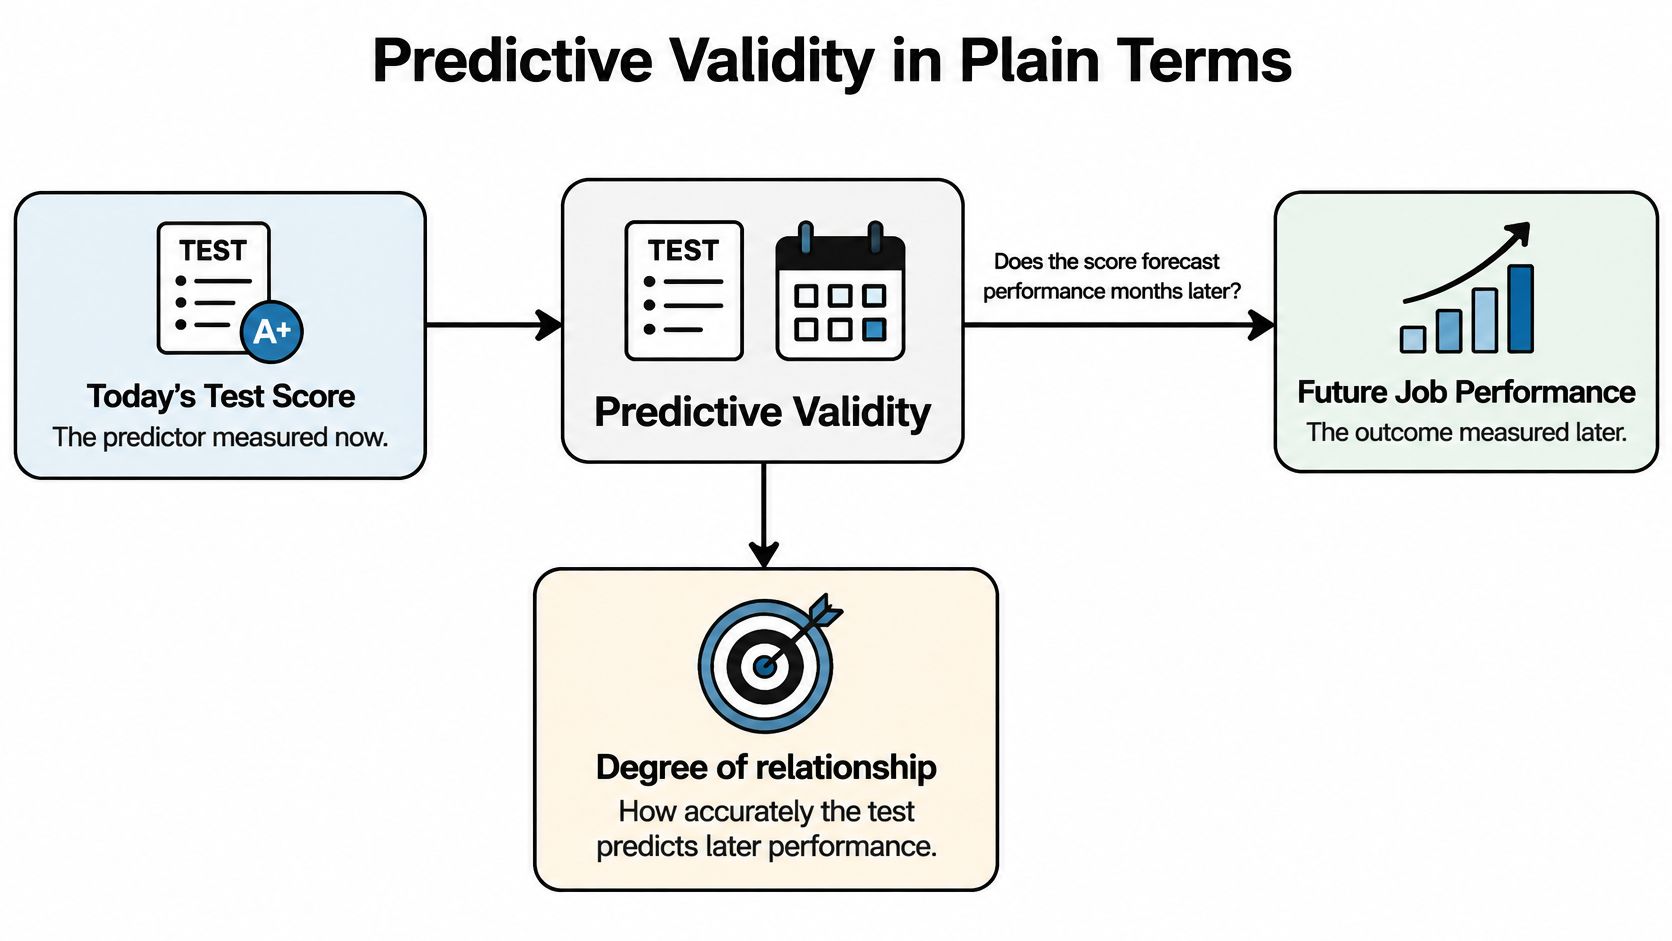
Three working parts make up any study of it. The predictor is the assessment score, recorded at the moment of decision. The criterion is the outcome you measure later, and it has to be something you care about rather than something convenient to count. The time gap between them is what makes the design predictive rather than a different kind of study altogether.
The strength of the link is summarized as a validity coefficient, a correlation that typically runs between 0 and 1. It can dip below zero when a score predicts the opposite of what you expected, which is usually a sign that something in the design or the scoring is inverted. A higher value means the score carries more forecasting signal in the sample that was studied. It says nothing about whether the tool is good in the abstract.
> The definition worth memorizing: predictive validity is evidence that a score is followed by a meaningful outcome in the future. Evidence for one job, one applicant pool, one period of time.
Predictive Validity Compared With Concurrent Validity
Both designs measure the link between an assessment and job performance. They differ in when the two pieces of data are collected, and that difference in timing is small on a calendar and enormous in what it can tell you.
In a predictive design you collect the score first, usually from applicants or people who have just been hired, then measure performance after a defined period on the job. In a concurrent design you collect the score and the performance data at the same time, from people already doing the work.
| Aspect | Predictive validity | Concurrent validity | | --- | --- | --- | | When the score is collected | Before the job decision | At the same time as the outcome | | When performance is measured | After a set period on the job | At the same time as the score | | Who is usually tested | Applicants or new hires | Current employees | | Typical score range | Full applicant range | Often narrower, since weaker performers may have left | | Speed and cost | Slower and more expensive to run | Faster and cheaper to run | | Main risk for hiring | Attrition and changing conditions can weaken the sample | Incumbent motivation and job familiarity can overstate validity |
Concurrent studies are the reason so much assessment evidence looks stronger on paper than it behaves in a live hiring process. Current employees already hold the job, so they read and answer questions differently from someone competing for it. Their motivation to engage carefully is often higher, particularly when the result feeds a development plan or a promotion file. And the people who would have scored lowest are frequently no longer on the payroll, which truncates the score range and distorts the correlation in ways that are easy to overlook.
None of that makes a concurrent study worthless. It's faster, cheaper, and a reasonable first pass when you want to know whether a measure relates to performance at all. The mistake is treating one as though it were the other.
> A practical rule: when the decision is a hiring decision, weight evidence from predictive or applicant-based designs. Treat concurrent results as a starting point, not as proof.
Before you ask a vendor what their number is, ask which design produced it and who was sitting in the room.
How Predictive Validity Is Measured Step by Step
A local study is more achievable than many assume. Six steps, in order, and the order is the part people skip.
1. Define the criterion before anything else. Choose one specific, job-relevant outcome: quarterly sales against quota, a supervisor rating on a defined scale, retention at twelve months. Write down how it will be measured and who records it. A vague criterion like "good fit" produces a vague correlation, and no statistical correction rescues it.
2. Record the predictor before the hiring decision. Capture the assessment score at the point of selection, before anyone is hired or rejected. Scores collected afterward absorb the manager's impressions, and the analysis ends up predicting something that already happened.
3. Wait out the outcome window and track who remains. A six-month window and a twelve-month window answer different questions, so pick one and state it. Count how many people are still in the role when the window closes, because attrition shrinks the usable sample and tends to remove the weakest performers first.
The first three steps in sequence look like this.
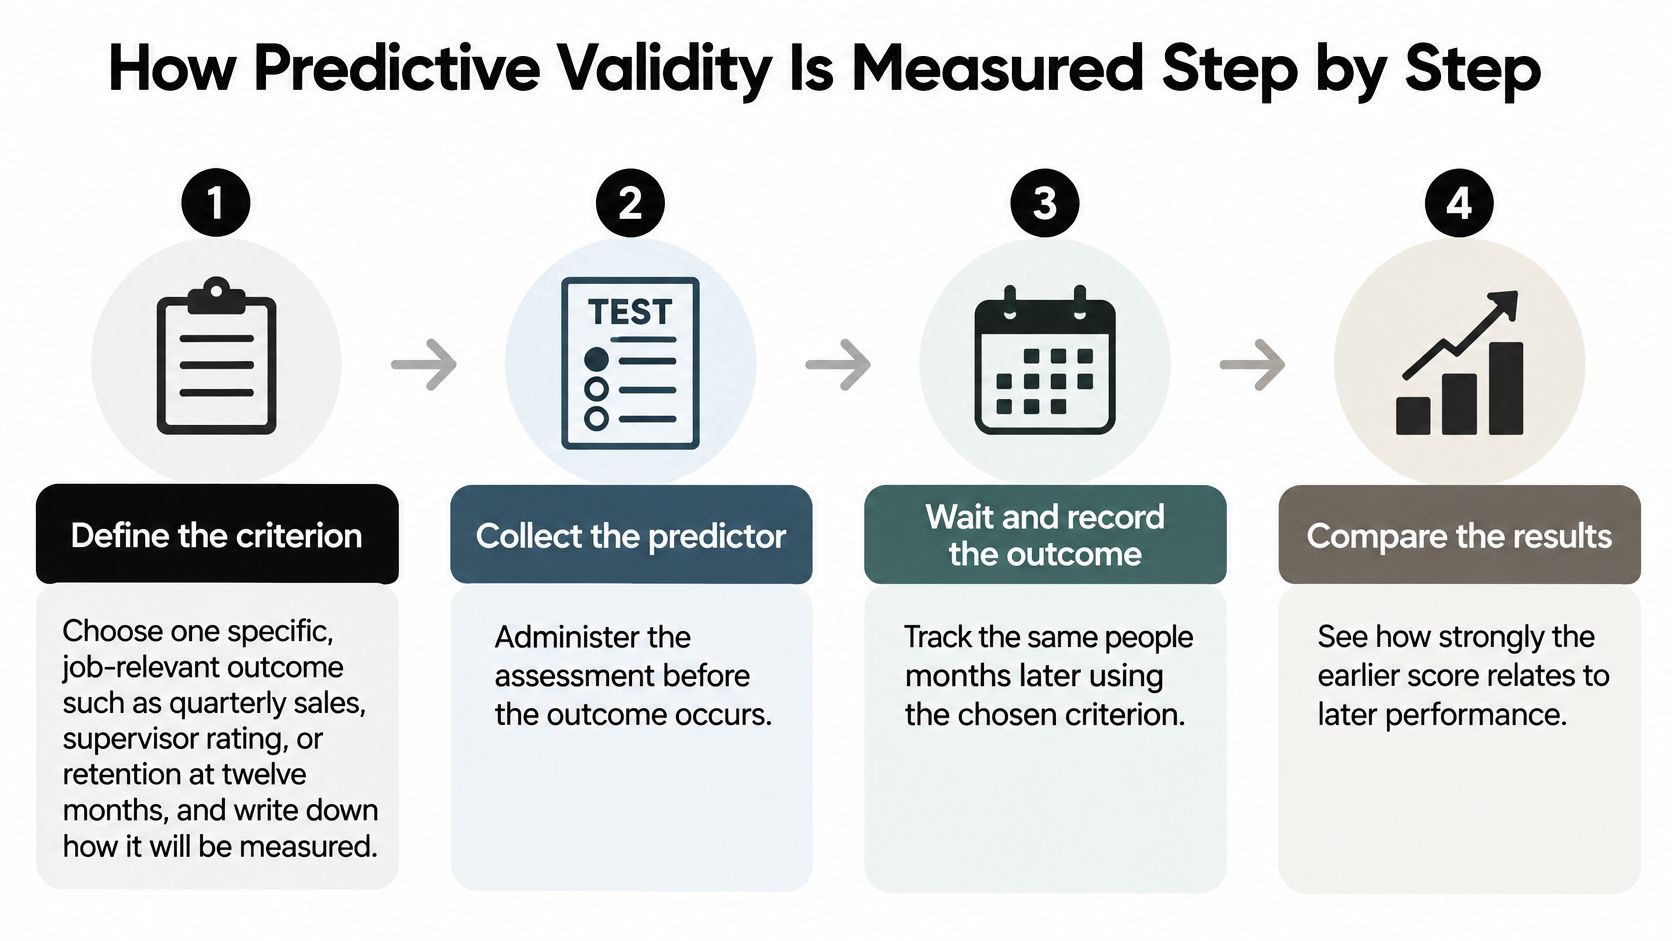
4. Calculate the correlation. Pair each person's earlier score with their later outcome and compute the correlation. That is your uncorrected validity coefficient. At this stage it's a draft, not a verdict.
5. Correct for unreliability and range restriction. A single supervisor rating is a noisy criterion, and noise understates a real relationship. An applicant pool clustered in a narrow score band does the same. Report the raw and corrected figures side by side so a reader can see how much of the final number came from data and how much from the correction.
6. Check subgroups, then repeat in the population that matters. Look at results for each group and each role you hire into. A coefficient that's strong overall but weak for the team doing the hiring is a finding about a different team.
> What a complete result reports: the criterion and how it was measured, the interval between score and outcome, the sample size and how many people dropped out, raw and corrected coefficients, and the subgroup breakdown.
A coefficient published without those five details isn't a finding. It's a souvenir.
Typical Predictive Validity Figures by Assessment Type
A coefficient is a reference point, not a promise. Its value depends on the assessment, how it was selected, and the people and jobs included in the research.
One review covered 494 studies, 97 independent samples, and 13,521 people. It reported corrected mean validity of 0.29 for confirmatory personality studies and 0.12 for exploratory studies, where researchers were testing rather than confirming a prediction ([Wiley review of personality measures and job performance](https://onlinelibrary.wiley.com/doi/abs/10.1111/j.1744-6570.1991.tb00696.x)).
| Measure | Reported value | Context | | --- | --- | --- | | Personality measures, confirmatory studies | 0.29 | Corrected mean across 97 independent samples | | Personality measures, exploratory studies | 0.12 | Same review | | Big Five extraversion | 0.16 | Lowest trait value in the same review | | Big Five agreeableness | 0.33 | Highest trait value in the same review | | Conscientiousness and overall job performance | r = .27 | Corrected for unreliability, range restriction and sampling error | | General personality factor and job performance | about r = .31 | Supervisor-rated and objective performance | | Cognitive ability and job performance (newer meta-analyses) | .16 to .23 | Mean operational validity estimates | | Cognitive ability (2026 synthesis) | about .31 | Cited comparison with structured interviews and work samples |
Conscientiousness has a measurable relationship with job performance, but it does not determine performance. A research overview reports a corrected meta-analytic correlation of r = .27 between conscientiousness and overall job performance, and roughly r = .31 for a broader general personality factor against supervisor-rated and objective performance ([VU Amsterdam overview of personality and job performance](https://research.vu.nl/ws/files/278187338/Personality_Personnel_Selection_and_Job_Performance.pdf)). These figures describe associations across studies, not certainty about any one applicant.
Why the same test family produces different numbers
Cognitive ability estimates also vary across reviews. Recent meta-analyses report mean operational validity of roughly .16 to .23 for cognitive ability and job performance. A 2026 synthesis puts the estimate near .31 in a comparison with structured interviews, job-knowledge tests, work samples, and empirically keyed biodata ([Journal of Business and Psychology synthesis](http://www.link.springer.com/article/10.1007/s10869-026-10146-8)). The difference is a reminder to ask what roles and outcomes a study covers before applying its coefficient to a local hiring decision. For a practical comparison, see how a [work sample test measures job-related performance](https://synopsix.ai/blog/work-sample-testing).
How to read a credibility interval
A credibility interval describes expected variation in validity across settings; a confidence interval describes uncertainty around an estimated average. An interval spanning near zero to a strong relationship signals that results can differ substantially by context. The average is a starting point, not a guarantee for a particular role or applicant pool.
A Hiring Example That Shows Predictive Validity at Work
A software company wants to predict which account executive candidates will meet quota by month twelve. It could start by buying an assessment, but a better first step is to define what successful performance looks like in that role.

Start with the role, not the test
A job analysis might show that top performers follow up with prospects other representatives have stopped pursuing, keep a disciplined weekly plan, and recover quickly after rejection. Those behaviors suggest relevant qualities to measure, including conscientiousness, resilience in prospecting, and comfort with structured follow-up.
Choosing assessment dimensions from job requirements can improve the fit between a test and the work it is meant to predict. In a 494-study review, personality measures based on job analysis had a corrected mean validity of 0.38 (the review of personality measures in personnel selection).
Evidence from other settings also points to the value of matching traits to outcomes. A meta-analysis of South African research combining 33 studies and 6,782 people found that Big Five traits showed validity for job-performance criteria similar to findings from other contexts. Conscientiousness was the strongest overall predictor, while other traits mattered for particular criteria or subsamples ([International Journal of Selection and Assessment meta-analysis](https://onlinelibrary.wiley.com/doi/10.1111/ijsa.12175)). The practical lesson is to test traits against a defined outcome, rather than rely on a general impression of a good salesperson.
For dispersed sales teams, the outcome also needs a consistent definition across markets. Companies that [hire from Latin America](https://lathire.com) or operate across several countries can compare results more fairly when they measure the same job-related criteria in each location.
The twelve-month check
The video below shows structured, evidence-based evaluation in a hiring context.
<iframe width="100%" style="aspect-ratio: 16 / 9;" src="https://www.youtube.com/embed/sxjgL64czRY" frameborder="0" allow="autoplay; encrypted-media" allowfullscreen></iframe>
At six months, the company compares assessment scores with quota attainment for everyone hired through the process. At twelve months, it repeats the comparison and adds retention as a second outcome. The scores were collected at application, so the team can test whether they predicted later results rather than only echoing interview impressions.
The team can then keep, adjust, or drop the assessment based on its own results. A validity figure from another role or applicant pool is a starting point, not a guarantee that the same relationship will hold here.
Reading a Validity Coefficient Without Being Misled
The most common misreading is that bigger is better and the highest number wins. A coefficient is a starting point for judgment, and six checks turn it into one.
1. Compare it with what you could use instead. The U.S. Office of Personnel Management notes that personality tests have demonstrated criterion-related validity for outcomes including overall performance, customer service, and teamwork, but also that they tend to be less valid than cognitive-ability tests, assessment centers, work samples, and simulations ([OPM guidance on personality tests](https://www.opm.gov/policy-data-oversight/assessment-and-selection/other-assessment-methods/personality-tests/)). A predictor can be valid and still be the weaker option.
2. Read statistical significance as a floor. A significant result tells you the relationship is unlikely to be zero. It tells you nothing about whether the tool is useful, affordable, or better than what you already do.
3. Judge the criterion. A single supervisor rating is a noisy measure, and noise caps how strongly any score can correlate with it, which is why [assessment validity and reliability](https://synopsix.ai/blog/assessment-validity-and-reliability) are always read together. A weak criterion makes a good score look poor, and a generous one makes a mediocre score look excellent.
4. Count the cost of both errors. A false positive hires someone who struggles. A false negative rejects someone who would have succeeded, and you never see that outcome. Which error hurts more depends on the role, the hiring volume, and how expensive a bad hire is to unwind.
5. Check subgroup error rates. A tool can predict performance overall and still misclassify candidates from particular groups more often than others. Fairness has to be tested rather than assumed, and the test is error rates by group, not the overall coefficient.
6. Ask for incremental value. The important question isn't whether the score predicts performance. It's whether the score adds accuracy beyond the structured interviews or work samples already in your process.
> The question to put to any vendor: does this add accuracy beyond what our current process already captures?
A coefficient is one input to a decision. It is never the decision itself.
Why Predictive Validity Does Not Transfer and How to Test It
A coefficient measured somewhere else is not a guarantee in your hiring. That sounds obvious until you watch a team adopt a tool because a published number looked strong, then discover eight months later that the number described a different job, a different applicant population, and a different labor market.
The methodological case for caution is specific. Personnel-selection evidence leans heavily on concurrent studies of people who already hold the job, and those studies can overstate or misrepresent operational validity, the accuracy you'd expect when the tool is used to select people in practice. One critical review concludes that current evidence may not support firm conclusions about criterion validity in real operational selection settings, and a related 2026 study using more than 130,000 observations found that predictive validity can shift as the composition of the applicant pool changes, improving under some conditions and weakening under others ([critical review of criterion validity evidence](https://research.vu.nl/en/publications/building-on-shaky-foundations-a-critical-review-of-criterion-vali/)). The practical gap is local validation: testing whether a score predicts relevant outcomes in your own roles, your own applicants, your own geography, and your own decision process.
A checklist you can run this quarter
1. Name the outcome and its measurement. One criterion, written down, with an owner and a date.
2. Confirm the vendor's evidence matches your situation. A study of a national retail chain doesn't describe a five-person design studio. If the population differs from yours in language, market, or job level, treat the number as context rather than proof.
3. Ask what drives the score. A coefficient says a score relates to an outcome. It doesn't say the score is measuring something you want to reward, or that it's free of factors unrelated to the job. Explanations of the key factors behind a user's results are available from Synopsix on request.
4. Set the review dates before launch. Month six and month twelve, with a named person accountable for each review. Monitoring after deployment is part of the evidence, not an afterthought.
It also helps to rehearse the decision before you make it for real. Simulations run multi-participant team simulations to test a hire, a promotion or a reorg before it happens in real life, which surfaces friction and risk while changing course is still cheap.
Then run the pilot. One defined outcome, one applicant pool, one review date, and a written comparison between what the scores predicted and what happened. Keep, adjust, or drop, in that order of preference. The closing question is whether the score adds accuracy your process doesn't already have, which is exactly what [incremental validity](https://synopsix.ai/blog/what-is-incremental-validity) measures.
---
Synopsix turns validated behavioral assessment into role-specific guidance, reading each person against the job, team, leader and culture rather than a generic profile, so you can see how a score connects to fit, risk and performance before you rely on it. If you'd rather test evidence locally than borrow a coefficient, run the free assessment in about ten minutes and use the profile as your first data point. Visit [Synopsix](https://synopsix.ai) to see how the platform takes you from assessment to a hiring decision you can defend.